In light of the events of today, it makes sense for the President and his Administration to appeal for calm.
From the International Herald Tribune:
“I believe that markets ultimately look at the fundamentals of any economy,” Bush said. “And the fundamentals of our economy are strong. Inflation is down. Real wages are increasing. The job market is a strong job market. People are working. Small businesses are flourishing.”
While I’m all for stabilizing the financial markets, I’m not sure talking about the fundamentals is the best way to go about it. Not that what President Bush is saying something demonstrably wrong. Just that some of these might prompt people to take a closer look at the data, and wonder.
First, inflation is down, depending on time frame, and which series.
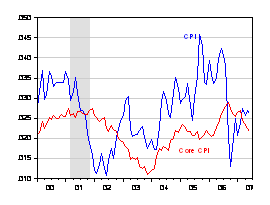
Figure 1: Year on year CPI inflation (blue) and Core CPI inflation (red), in log terms. Source: BLS and author’s calculations.
Second, real wages (defined as CPI-RS deflated compensation) are rising, and faster than the last expansion. However, the distribution of the gains are skewed toward higher income deciles in the current expansion (red bars in Figure 3).
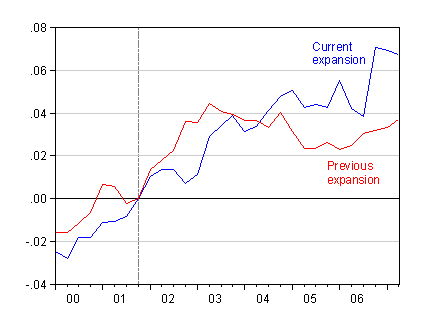
Figure 2: Log level of real compensation in the business sector, deflated using CPI-RS, defined relative to NBER defined recession troughs. Current expansion (blue) and Previous expansion (red). Source: BEA via FRED II, NBER, and author’s calculations.
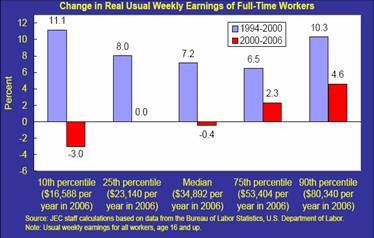
Figure 3: Change in real compensation by different income levels. Source: JEC Democrats.
Third, while GDP is rising, it’s important to remember that the first half of 2007 was less than stellar. And according to the 8/7 WSJ poll, q3 and q4 q/q SAAR growth will be 2.3% and 2.5% respectively. Given the trillions of dollar of fiscal stimulus, and the extended period of negative real interest rates, this rate of growth is less than impressive (the graph presents the current expansion against the previous).
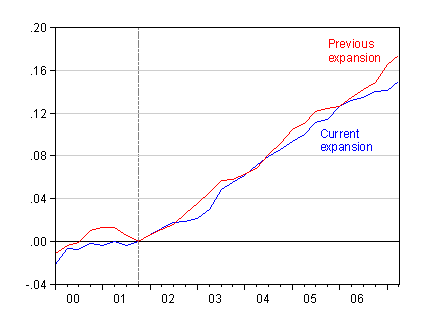
Figure 4: Log level of real GDP in 2000Ch.$, defined relative to NBER defined recession troughs. Current expansion (blue) and Previous expansion (red). Source: BEA via FRED II, NBER, and author’s calculations.
Fourth, employment growth is still positive, especially according to the establishment survey. Whether it’s “strong”, I leave for others to judge (the graph compares the current expansion against the previous). Even according to the household survey, employment growth is below the previous expansion. Note: don’t look at the pace of grwoth in the last seven or so months if you are faint of heart.
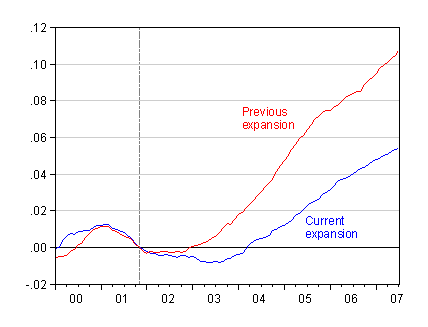
Figure 5: Log level of nonfarm payroll employment, defined relative to NBER defined recession troughs. Current expansion (blue) and Previous expansion (red). Source: BEA via FRED II, NBER, and author’s calculations.
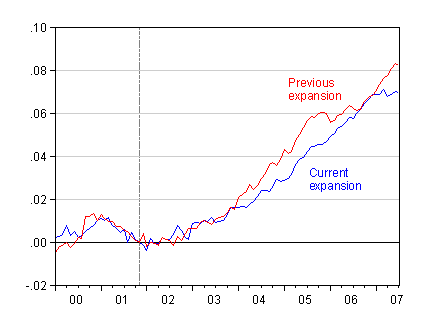
Figure 6: Log level of civilian employment (household survey), defined relative to NBER defined recession troughs. Current expansion (blue) and Previous expansion (red). Source: BEA via FRED II, NBER, and author’s calculations.
Finally, while small business is flourishing, all I know is hiring by small firms is decelerating, according to ADP.
So I’ll look for my reassurance elsewhere.
Technorati Tags: fundamentals,
employment,
inflation,
wages,
GDP,
recession.
We learned yesterday Bush’s latest prescription for what ails ya. More tax cuts. As Kevin Drum says, he’s like a Chatty Kathy doll. You pull the string and he says “Tax cuts.”
First, inflation is down, depending on time frame, and which series.
You’ve got that right. For example, don’t look at the seven month chart of the non-seasonally adjusted CPI-U. It might scare the you know what out of you. 😉
Last fall we had a big commodity selloff. Commodities have since recovered. The year over year inflation number will probably be quite high if we don’t get another similar selloff this fall. Based on recent stock market activity I wouldn’t rule it out, but then again I wouldn’t count on it either. Selloffs of that magnitude are rather rare and virtually impossible to predict (or we’d all be rich doing it).
The CPI-U was 208.352 in June. It was 201.5 last November. That’s a raw increase of 3.4% (not annualized or seasonally adjusted) in just the last seven months.
The inflation numbers coming out over the next five months better be extremely tame or the headline inflation number is going to look rather ugly soon. Tame won’t be good enough. We’re at 3.4% already. Any further inflation in the next five months is just a “bonus”.
They say the stock market looks six months ahead. Perhaps it is partly seeing what I’m seeing. Perhaps it is imagining something nasty. You know, like headline CPI numbers actually show up in the headlines. D’oh! (tongue in cheek)
On the other hand, if I could predict the future and knew that headline inflation was quite tame in November I’d still be bearish I suppose. Holy cow! What did we have? Actual deflation? Why? I’d certainly want to know more before investing in risky assets right now.
Such is the life of bucking the trend and riding this possible anti-risk wave of non-euphoria. I’m sitting in TIPS, I-Bonds, and short-term treasuries these days. Can’t complain. Before that I was a true stagflationist. Yeah, I bought shiny rocks. Shiny rocks actually beat the market. They didn’t even pay dividends. The Fed clearly wanted me to buy hard assets though. I complied. Now they don’t seem to know what they want me to do next. Neither do I. I’m twiddling my thumbs just like our leaders. Hopefully I’ll know it when I see it though. No hurry.
Behold the power of borrowing (and printing) prosperity.
What would you expect the President to say,that the economy sucks? His words are meaningless.
However, the distribution of the gains are skewed toward higher income deciles in the current expansion (red bars in Figure 3).
So what.
Increasing returns to education.
My masters degree is FINALLY paying off. I can’t see how that that is a bad thing. God knows that I worked hard for it.
Increasing returns to work.
Are YOU working a lot of hours? I am. Shouldn’t we be properly compensated for working as much as we do?
In times like these (credit crunch/financial panics similar to Oct. 1987, LTCM in 1998, Continental Illinois in July 1984 or even Bankhaus Herstatt in June 1974), it’s what the Fed says and does that matters, with both the best and worst of Presidents being rendered totally irrelevant.
Unfortunately, the U.S. Fed/FOMC chose to take a nonsensical hard line at their meeting last Tuesday and the crisis has continued to intensify. Before this is over, we’ll likely have another name to add to the list above, we just don’t know what it is (yet).
Anarchus: The Fed has now taken the appropriate steps now to provide ample liquidity in short term operations (Reuters).
Buzzcut: While it is true that the theory of human capital suggests that the rate of return on education should be positive so that some people get higher wages, it’s not clear to me that changes in technology and trade explain most, or a substantial portion, of the divergence in wage trends (and it’s kind of strange to see such a change in differential returns occur so quickly). Even if it were the case that these factors caused 100% of these trends, I don’t think I’d then conclude that that was a perfectly fine. There have been government programs to intervene in the market before.
Even if it were the case that these factors caused 100% of these trends, I don’t think I’d then conclude that that was a perfectly fine.
Why not?
There is a question I have about these comparisons for employment: Do they (and should they) correct for the depths of the troughs from which the start of the expansion is measured? After all, unemployment went to a low of 7.8% in 1992 but only to 6.3% in 2003. So almost by definition, a return to “full” employment, or close to it, is going to look a lot better in the previous expansion, isn’t it?
Another issue with the numbers would be the women’s labor force participation rate expansion which ended in 2000. I understand that some argue that a weak job market is why the rate hasn’t increased, but demographics is likely at least partially responsible
I’m not necessarily disagreeing with you about the conclusions, and for all I know those issues are either corrected for or irrelevant (especially the participation rate issue, since the increase wasn’t all that substantial during the 1990s). And I should say I’m not a macroecoomist. But those concerns would make the charts look different (especially figures 5 and 6), wouldn’t they?
THE MONETARY ECONOMIC THOUGHT
OF BENJAMIN BERNANKE
“Savers and their financial advisors know that to get the highest possible returns on their financial investments, they must find the potential borrowers with the most profitable opportunities. This knowledge provides a powerful incentive to scrutinize…
Well Buzzcut,
If all the low-educated, low-talent scum that you look down on have no money to spend, then all the smarts that your masters degree confers on you will have no effect on your employer’s ability to sell things. And that will eventually have an effect on your income too.
If I’m reading this right, wouldn’t a lot of the leveling off of the “previous expansion” that seems to be in the 2006 area of the charts coincide with 1998 and LTCM and the Asian crises? If that is so, I imagine by the time this housing disaster shakes out the differences in employment and GDP growth between this expansion and the previous one will be even larger.
Also, the charts show why GDP can’t be the only indicator of whether some policy works or not- the massive differences in benefactors from the ’90s to the 2000s is obvious. I’d also like to see per-capita GDP increases compared, as immigration seems to be more in the 2000s, and that could skew numbers.
Lastly, in a country that now has 70% of its economy based on consumption, those income gaps are not a good thing to see, especially when you realize it’s those people in the bottom three rungs that are feeling this subprime and mortgage meltdown.
If all the low-educated, low-talent scum that you look down on
Speak for yourself.
Also, I find it interesting that the source starts from 2000, which is actually the peak of the last expansion. Hmmmmm… so it cast some doubt on the veracity of the comparison. It would be similar to comparing 1989 through 1995. Drawing conclusions from data based on a previous expansion’s peak is a bit misleading, and that is without even getting into the static nature of income distribution data. Secondarily, I do believe from the studies that I have read that increasing returns to education is a long-term phenomenon, going back 30 years. I don’t have the exact citations to post. And fundamentally in a knowledge-based economy, we would expect that ceteris paribus, returns to education would be increasing, thereby creating market incentives for greater education on the part of the work force. Coincidentally enough, that is exactly what is happening.
Chirs Vickers,
The short answer to your first question is “yes.”
The long answer is, Menzie’s plotted the (log of) employment (in figure 5, for example) relative to its value at the NBER-dated trough of each of the last 2 recessions. These were March 1991 and November 2001, respectively (ie, the starting points of the last two expansions).
So according to fig 5, employment is up nearly 6% from its 11/01 level, whereas at this point in the previous expansion it had increased about 11% from its 3/91 level.
Buzzcut: One might be interested in how the returns to education are allocated if access to education, for instance, were not equitably distributed, either because of government distortions or because of market imperfections. Further, there is a long-standing academic debate over whether the higher wages to higher credentialed individuals is due to higher returns to human capital, or due to signalling.
Chris Vickers and Nathan: Yes, in an academic paper to be submitted to a peer reviewed journal, one might very well want to correct for demographics, and other factors. Some discussion of participation rates has been presented by Jim ([1], [2]), myself ([1]), and also on Angry Bear ([1]).
foo: Let’s try to not put words in other people’s mouths.
Nathan: I’m not a labor economist, but as one who teaches international trade, it’s my recollection that during the 1970’s there was an upsurge in relative wages, then a narrowing of the college/high-school only wage gap, and finally most recently another increase — although the latest increase (I think last five years up to about 2003) is in the post-graduate category, including lawyers and doctors. (By the way, if you’ve got a picture with the growth rates broken down starting from trough, please send it along and I’ll post — I used what I could get my hands on readily, such is the blogging business. Although I don’t think the basic message would be much different if we started 1991 and 2001 and compared changes over 5 years.
Professor Chinn, is there a quick textbook description of what happened yesterday? The situation as I understand it: German bank (and many more funds) have borrowed short term funds to purchase tranches of CDOs. The short term loans are due, but the market for CDOs has collapsed. So the german bank/funds cannot sell their CDOs to pay back the short term loans. This information (news of the German Bank) causes a credit-crunch fear-induced wave of selling in equities, the proceeds of which are used to purchase treasuries, which causes short term rates to decline. But apparently the demand amongst banks for very short term funds has increased such that the short term rate is bid up well over the fed funds rate target, and this dominates any downward pressure on rates caused by equity investor flight to short-term treasuries. Fearing a liquidity crisis amongst banks, bank defaults, and various forms of panic, the central banks pump money into the system so markets can correct? Why? If CDOs are worth far less than the mark to model price the hedge funds have been imputing into their reported performance, then how is short term intervention going to help?
Anonymous: I don’t know if there is good textbook description, but you are asking the right question. Injections of liquidity will enable those firms that are engaged in contracts that but face a liquidity crunch — but are basically solvent — to implement the transactions they wish to. Those firms that have made a bet on CDOs retaining their value at certain levels not justified by the fundamentals will face insolvency. In other words, the injection of liquidity should seek to reassert market conditions such that CDO’s are valued at levels consistent with their fundamentals. Overdoing the injection of liquidity — something the central banks are attempting to avoid — would make CDO’s overvalued, which might in the short run feel good, but in the long run might make problems worse to the extent that it makes investors feel like they are insured against downside risk.
The problem is figuring out how to apportion what amount of the revaluation of CDOs is due to an epiphany regarding market (including macro) conditions going forward and how much is due to short term illiquidity problems.Nouriel Roubini, for instance, sides on the insolvency argument. I don’t claim to know enough to make an informed judgment myself.
See also Paul Krugman’s column reproduced at Economists View.
I just noticed that some comments have popped up after a delay. I apologize for this — I suspect this is the spam filter or the like waiting for authorization. In any case, if your comment doesn’t appear after a bit, you can email me.
Stagflationary Mark: Why do you use non-seasonally adjusted data?
jim miller: He’d be on safer grounds pointing to other indicators (industrial production, exports, consumption, maybe non-residential investment, profits) rather than shaky ones. Also, some statement about how the regulatory agencies might be (more than in the past) carefully monitoring the financial system would be helpful. Given the President’s previous record on keeping an eye on, say, post-War Iraqi reconstruction, that’s the sort of systemic-policy statements I’d like to hear.
Anon: I’d recommend perusing any of the good financial history books on past credit crunch cycles, from “The Credit-Anstalt Crisis of 1931” by Aurel Schubert, to anything on “Herstatt Risk” and both of the good books on the LTCM crisis of 1998 (Roger Lowestein wrote one and Nicholas Dunbar the other) . . . . . . . this time the precipitating cause is subprime mortgages and CDOs, but next time it will be something completely different (and there WILL be a next time), so I wouldn’t recommend spending any time trying to understand the nuances of tranches and mortgage theory.
What’s important to remember is that the majority of large financial institutions are completely dependent on very short term funding, so any major credit-related or counter-party failure panic is highly likely to produce what we’re seeing at the moment . . . . . . . . it’s why the U.S. has federal deposit insurance (on a limited basis) to try to preclude “runs on the bank”, and why some smart bankers have worked hard to pursue a retail funding strategy based on smaller depositors to reduce their dependence on fast money funding. Some financial analysts think that it’s the main reason why Capital One Financial (the credit card giant) bought Hibernia Bank in Louisiana a couple of years ago — and I think they’re looking pretty smart right now for having done so.
Now that the Fed has established a new policy of buying up distressed investments due to the housing bubble, I wonder if they would be interested in taking off my hands at an advantageous price a REIT mutual fund that has been recently hammered.
And now that the Fed has been tagged and owns the mortgage securities, who is going to buy them back, and at what price. In a game of tag there is a rule called “no tag backs.” From Wikipedia “This means that the person who is “it” can’t immediately tag the person who made them “it”. This rule was created to allow the former “it” player not only a chance to get out of close proximity of the current “it” player, but to give them a few moments of immunity to catch their breath. Another way of ensuring victory is to tag someone and then immediately quit the game (often to the annoyance of the other players, who may exclude the person using this strategy from future games). Whether or not “tag backs” are allowed in the ensuing game must be established at the start of the game to ensure fairness of play for all players.” It’s amazing how childrens’ games are preparation for adult life.
Stagflationary Mark: Why do you use non-seasonally adjusted data?
I understand the reasoning behind the attempt to smooth the data using seasonal patterns, but I’d personally rather look at the actual change in prices and draw my own conclusions. For example, the Christmas season tends to be a bit deflationary these days. I factor that in. Seasonally adjusted data tends to be a bit too black box for my liking and has its own set of unique problems. I therefore only tend to use it when I’m too overwhelmed (employment reports for instance) to make sense of the raw data. Perhaps if I knew exactly how much last fall’s commodity selloff (or the rising price of oil for that matter) was altering the trend lines in the seasonally adjusted CPI I’d be more comfortable using it, but I don’t.
As seen on the government website…
Some index series that show occasional erratic behavior known as a ‘trend shift,” which can cause problems in making an accurate seasonal adjustment…
So what did they do with last fall’s commodity selloff? I wouldn’t have known what to do if I was them. Clearly they have to make a “gut” call. It isn’t like I distrust their attempts to make an accurate estimate. That’s not the issue. I’d simply prefer to use my “gut” instead.
In recent years, BLS has used intervention analysis seasonal adjustment for various indexes–gasoline, fuel oil…
In a nutshell, I’m not sure whether anyone really knows if the price of gasoline is volatile noise, a short-term spike based on recent ultra low interest rates, or simply a new trend based on Peak Oil. I certainly don’t know. I’m tempted to think it’s a little bit of each. I do know, or think I know, that making many “adjustments” to the rear view mirror might not even be all that useful when trying to look out the front window.
I’m most concerned with the psychology of what will happen in five months time. I can look through even the raw CPI data and see what June through November normally brings. Normal might assume interest rates were kept steady (which they weren’t). However, if it is somewhat typical, will the headline CPI number scare investors in October and November? I tend to think it might, especially since the powers that be (i.e. Bush) are talking about how low it is right now. “Right now” is using 12 month old data though. It MIGHT be more accurate “right now” to look at just the last six months (and in that case inflation is not tame). Only time will tell.
Since the Fed has established a new policy of buying up distressed investments due to the housing bubble, I wonder if they would be interested in taking off my hands at an advantageous price a REIT mutual fund that has been recently hammered.
And now that the Fed has been tagged and owns the mortgage securities, who is going to buy them back, and at what price. In a game of tag there is a rule called “no tag backs.” From Wikipedia “This means that the person who is “it” can’t immediately tag the person who made them “it”. This rule was created to allow the former “it” player not only a chance to get out of close proximity of the current “it” player, but to give them a few moments of immunity to catch their breath. Another way of ensuring victory is to tag someone and then immediately quit the game (often to the annoyance of the other players, who may exclude the person using this strategy from future games). Whether or not “tag backs” are allowed in the ensuing game must be established at the start of the game to ensure fairness of play for all players.” It’s amazing how childrens’ games are preparation for adult life.
Is anyone (except me) concerned about the possible negative message the Fed may be giving the market? Any action by the Fed needs to be tempered by the need to avoid encouraging moral hazard.
Historically, banks were incentivized to avoid excessively risky lending because the loan remained on the banks’ books. Now investment brokers, underwriters, rating firms, etc., have an incentive to make the loan because they only get paid if they make the loan. Those who have the fiduciary responsibility do not face the proper incentives and the result is a credit crunch.
The current problems represent a classic example of regulation/innovation/crisis/regulation.
“I wouldn’t recommend spending any time trying to understand the nuances of tranches and mortgage theory”.
I suppose its useful knowledge if you wanted to surf in bottom feeding land. One thing that will be interesting to look at is to see what happens when a whole class of investment’s paradigm shifts. It is little like when stocks and bonds expected yields swapped positions sometime after WW2. Where the formally investment grade tranches land will be interesting. And the fact that the Alt-A loans with lower defaults have a less protective structure in some regards then the subprimes will also be a factor going forward.
GW has the “George Castanza” syndrome (i.e. Seinfeld).
Every single action GW made in the past 7 years has been exactly the opposite of what should have been done. He has pretty much destroyed every thing he has touched.
I interpret reassurance regarding the economy from the current President as VERY SCARY.
He got absolutely everything else wrong, so why would he have THIS right??
August 10, 2007
Well, that was a week-and-a-half, that was!
As proof, I offer up the TSX Press Release which states:
There were 707,441 trades today on Toronto Stock Exchange, a new historical high. The previous high was 704,261 trades on August 9, 2007.
I feel a bit …
One might be interested in how the returns to education are allocated if access to education, for instance, were not equitably distributed, either because of government distortions or because of market imperfections.
That’s a funny comment from someone employed by a hugemongous public university.
Access to education is about as equitably distributed as it possibly could be. What is not equitably distributed is desire nor ability.
Pretty much anyone who wants to get a college education can get one. Access to the better public schools and universities may be more difficult, but then if they were easy to get into, “no one” would want to go there.
As for the signalling vs. skill debate, that really has no bearing on policy as far as I can see. I still had to invest time and treasure to get the degree. Why shouldn’t I get the ROI?
Buzzcut: As I’ve said before, I’m a social scientist first. It could be, by the way, that we continue to under-invest in education, or allocate our education dollars in the wrong proportions, so the distortion could still be there, even if the aggregate dollar amount was at the right levels.
If higher returns to education are due to signalling, your investment makes sense from a private perspective, but not a social one. If the higher returns are due to actual skill augmentation, then the investment might make sense from both perspectives, but if the benefits have spillovers to the larger society, then the market will under-allocate to education, in this case. So it matters.