Stuart Staniford and colleagues continue to provide a great service for the rest of us in compiling the facts about new oil discoveries.
Here at Econbrowser we have often made use of independent efforts by Cambridge Energy Research Associates and Chris Skrebowski to compile data on all the major new oil projects around the world. This is in principle quite doable, since press releases about these projects are invariably provided by the companies and countries involved. But collecting all of this separate information together into a single database in order to document the historical and future trends is a rather daunting task.
Several of the authors at the Oil Drum have launched a Wikipedia project in which they and a number of other diligent souls are collecting this information and making it accessible for everybody. The basic data assembled are intended to include all of the significant projects that would add new oil production capacity, including, when available, estimates of the peak flow anticipated from that project.
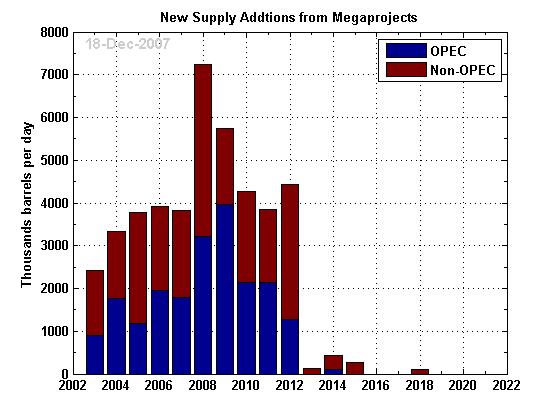
Although this is an ongoing effort, the graph below summarizes the current estimates, which show a big surge in new projects currently scheduled to begin production in 2008.
 |
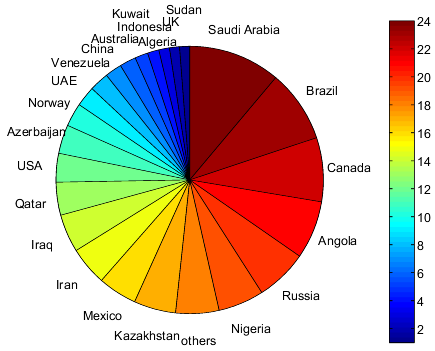
The additions will come from a number of different countries, with Saudi Arabia, Russia, Angola, Nigeria, Mexico, Brazil, and Kazakhstan accounting for about half of the 2008 additions. The graphic below identifies the relative contributions of different countries to the cumulative gross increase over 2003-2018.
 |
This of course does not mean that actual oil production will increase by over 7 million barrels per day next year. Because production from older fields naturally declines as the oil is removed, we need to find something like 3-1/2 million barrels per day in new production each year just to keep global production from falling. And although the projects identified above as having a 2008 start-up are supposed to begin production next year, production at the peak levels reported above is often not anticipated until 2010 or later. Stuart further cautions:
The wave of oil in 2008 is a prominent feature of the tables at present, and I’m sure will give great comfort to late-peakists. It’s perhaps a bit premature to put too much store in it yet. The years 2007, and especially 2008 are different from 2003-2006 in several important ways. One is that they’ve been largely compiled by different people, and the process might be at different stages of completeness. The other is that 2008 project schedules could still incorporate a certain amount of hope likely to be dashed by the usual complications that enter into all project schedules as they make contact with the real world. So some fraction of 2008 projects, and a much smaller fraction of 2007 projects, will get delayed. The past is less subject to unexpected delays.
Still, these numbers convince me that we are likely to see a significant increase in production in 2008, and an economic downturn would surely produce a drop in demand. I’m standing by the assessment I offered last month: for the time being, oil prices have peaked.
Technorati Tags: oil,
oil prices,
Saudi Arabia,
oil supply,
energy economics,
economics,
OPEC
For what it’s worth (granted, not much):
1.I’ll repeat my oft-repeated mantra. I bought at $35 and $55 (in some fashion), but haven’t since. Seemed risky. And the portfolio is aleady too heavily weighted towards commodities and energy. But I’m not selling either.
2. On the topic of predictions: I always thought Simmon’s predictions ill-served those who seriously look at energy–providing skeptics with an easy target. But I’ll also point out the 8-Dec-05 JDH comment that oil might be appropriately priced at $60. This is not a slam on JDH’s current prediction–I tend to agree–but you know what they say about predictions.
All I’m saying is that a lot of good reasons were provided in the past why oil might be reasonable priced at $60 and now we’re sitting at $90, 50% higher. I don’t have the time nor energy to compare previous conditions with current ones in order to figure out whether oil is now reasonably priced at $90, once again 50% too low, or 33% too high (and we’ll return to $60).
But I still think $55 was a good buy (though it made me a bit nervous at the time). That’s pretty much all I know.
Like I said: not much.
General Specific, I intended neither the December 2005 assessment, nor the current statement, to be construed as a prediction over a two-year horizon.
In December 2006, one year after the statement you quote, WTI stood at $62. And you call that a bad prediction? Give me a break.
For the record, I am currently predicting that oil prices will come down over the near term. I am not saying that they will stay down forever.
JDH: Let me phrase so people don’t get me wrong. The 2005 prediction was great. Granted, the predictions or observations are not necessarily quantified, since they include phrases like “significant increase” and “for the time being” (i.e. price and time windows are not specified). But that’s fine as well. I thought and continue to find Simmons irresponsible when he makes specific predictions. I prefer yours. His I now ignore.
All I’m saying, for what it’s worth, is that if I mentally recollect your posts in the last few years, I’ve not seen the information that would make me believe oil would drive up 50% above the $60 value that seemed expensive–historically speaking–at the time. To ask for information of that sort in your blog is asking for the impossible. I’m not asking. Just observing.
It seems reasonable that oil could be $80 a year from now. I can also imagine it at $60, or $120. All are very much in the realm of possibility.
“I’m standing by the assessment I offered last month: for the time being, oil prices have peaked.”
Does this mean that the “inflation ex-inflation” crowd will begin wringing their hands about deflation?
Thanks for the attention to the project JDH. I just want to stress again that those of us involved in it are not certifying the tables as complete, so reader beware in trying to draw conclusions from them. Also, interpreting them without an adequate theory of how delays enter into the picture is tricky at best. In particular, in past megaproject analyses, there is always a wave of oil 1-2 years away – in 2004 it was coming in 2005, while in 2005 it was coming in 2006 and 2007. Now it’s coming in 2008.
So it will take further analysis to be truly confident that this 2008 new capacity is a large enough effect to overcome the delays and/or accelerating declines that have caused past apparent increases in new capacity to fail to increase production.
That said, the “apparent wave” is bigger now, so maybe this time it will really reach us (just as demand collapses in a recession, perhaps 🙂
PS. You have a typo in my name on the first line.
Point well taken, Stuart. And thanks for calling my attention to the typo (now fixed).
One of the first postings I made on The Oil Drum when I became aware of this topic called attention to the difficulty of forecasting the supply-demand difference. Statistically, when you have two data items that are roughly equal, and both have substantial error bars, then if you try to compute their difference, the error percentages explode. You end up not being able to say much at all about the difference. In this context it means that we can’t say whether “supply” will exceed “demand” or vice versa (restricting our attention to prices we have seen recently, say the $70-90 range).
I’ve recently been exposed to an economic result which is IMO very significant and worrisome in terms of attempts to make these kinds of predictions. Weitzman’s “Dismal Theorem” is discussed in the context of climate change but I see it as having wider applicability.
http://www.fnu.zmaw.de/fileadmin/fnu-files/publication/working-papers/dismaltheoremwp.pdf
The claim is that the probability of extreme events decreases more slowly (as we move to greater extremes) than the impact of those events. Therefore when we calculate expected utilities, outcomes in these “fat tails” of the probability distribution dominate the calculation. In effect this is a formal statement of the “Black Swan” argument that people underestimate the chances of rare but catastrophic (or at least world-changing) events.
The implication is that much of our economic and political structure is futile, once we go far enough into the future that Black Swans are reasonably probable. Our political and economic institutions attempt to model, predict, prepare for and control outcomes on a multi-decadal time frame, but the Dismal Theorem says that outcomes are likely to be dominated by extreme events – which by their nature are so varied and random that they cannot effectively be modeled.
In this light, most of our efforts at long term planning have to be seen as having psychological value only, providing reassurance and an illusion of control in an intrinsically unpredictable and uncontrollable world. Rather a dismal result indeed.
Hal: Point taken.
One qualification I’d like to add. When I’m considering oil prices–at a very qualitative level–I’m not even consdering the so called black swans, the catastrophies, whether war with Iraq/Iran, the stability of Saudi Arabia, hurricanes, etc. If I think about oil prices in the past couple years, when it jumped from $60 to $90, I wonder about the cause. To what do we attribute this price increase? Supply/demand? Increased probablity of catastrophe (Iran/Saudi Arabia/hurricanes? Increased concern about depletion? Knowledge of increased rig counts in Russia? Herding into commodities?
So when I think of the current price as a peak in oil prices for the time being, I wonder how we can know this with any certainty, even ignoring the black swans. When I looked at JDHs $60 price in end-2005, I had also looked at his discussion of the $60 price end-2006 (I should have mentioned this, as I was never discounting his conclusions in a general sense). But soon after 2006, we found ourselves at $90. Almost $100.
What information produced a 50% increase in price? And what new information will allow prices to stabilize? How far into the “new developments” path do we need to go before we either discover (a) supply can keep up with demand (possibly even reduced due to recession) or (b) supply still will not keep up with demand.
I’m not looking closely enough, but even discounting the black swans I wonder whether the “hope” as Arnold Kling puts it when he refers to this blog post is misplaced. What are the time windows? The price windows? And what caused the last 50% increase.
I might not be looking closely enough. But right now I just don’t know the answer to any of these questions. Nor where to look to find those answers–except in pieces here and there. I think about the rig counts that Staniford put up for Russia and I wonder whether “hope” has lost its meaning. Cornucopians were hoping for $20 oil by now.
What is the price of “hope” now?
You’ve placed a caveat on all these prediction because of black swans. I’m wondering whether a big caveat needs to be put in place because of white swans, the ones that are all around us.
I think that the rise in oil price represents a “Black Swan” bet based on the understanding that demand is largely inelastic. ANY disruption in supply is likely to result in a significant price spike.
Oil Price Outlook: Megaprojects Offer Hope
A few hardy volunteers at the Oil Drum are tabulating press releases from dozens of companies to identify expected output from megaprojects. It’s a large task, but they are doing it. Their chart is intriguing: Hat tip to Jim Hamilton
JDH: I think any statement you make about expected future price should also reference the market future price.