And a bit on the IMF’s revised forecast for the US.
From Reuters, “U.S.’s Paulson praises China on currency progress”:
BEIJING, April 2 (Reuters) – China has made substantial progress toward adopting a more flexible currency that will help it cope with inflation pressures from rising food prices, U.S. Treasury Secretary Henry Paulson said on Wednesday.
After a day of top-level talks with Chinese leaders including President Hu Jintao, Paulson said he felt China lacks adequate capital markets to have a fully market-based currency but that remains the ultimate objective.
“I acknowledged to President Hu the very material progress that they’ve made with their currency because they have a currency that more accurately reflects underlying economic fundamentals,” Paulson said, adding that gives China “a very important tool” in its bid to keep food price rises in check.
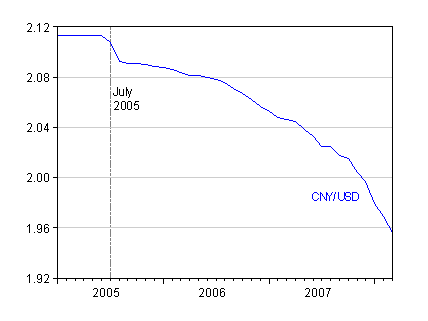
In Figure 1, I’ve plotted the CNY/USD exchange rate in logs. The fact that the slope of the curve is getting steeper, even when logged, means that the percentage rate of CNY appreciation against the USD is accelerating.

Figure 1: Log CNY/USD exchange rate. Source: FRED II.
However, at this point, two observations are necessary. First, the USD has itself been depreciating against a broad basket of currencies [0], so in order for the CNY to be appreciating against a basket of currencies of China’s trading partners, the pace of CNY/USD appreciation would have to be fairly rapid (after all, as noted by Brad Setser, the US no longer has a “strong dollar” policy). Second, in order for adjustment of trade balances to occur, real exchange rates would have to be moving.
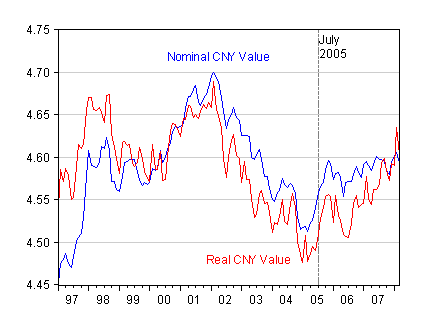
Figure 2 depicts the nominal and real trade weighted value of the CNY, as calculated by the BIS.

Figure 2: Log nominal (blue) and real (red) trade weighted value of the CNY (broad). Source: BIS.
What Figure 2 indicates is that the nominal value of the CNY is essentially the same in March 2008 as it was in the 3rd quarter of 2005 (This observation is made by Setser as well). Interesting, however, is the fact that the real value of the CNY does seem to be rising in a pronounced fashion. A little notation is helpful to explain why this pattern is observed.
The (log) real value of the CNY is defined as:
r CNY = e – p * + p China
where e is the log nominal value of the CNY, p* is the log price level of the rest-of-the-world, and pChina is the log price level in China.
While inflation rates in China’s trading partners have picked up, Chinese inflation has definitely accelerated [1] [2], to 8.7% in February (12 month rate). That means as pChina rises with inflation, r CNY rises as well. So while it’s true the CNY is appreciating in real terms, it’s not so clear it’s arising so much from currency flexibility. (See this post for a more general discussion of why nominal flexibility and real exchange rate reversion might not be correlated.)
It’s a bit difficult to discern exactly what the trajectory of the real CNY is, given the volatility of the series (in addition, I suspect the last observation for the real rate is estimated, since CPIs for March are not yet available for all countries).
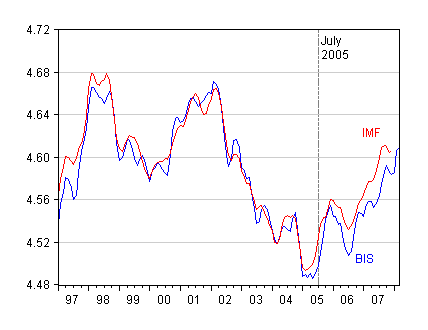
In Figure 3, I plot the three month moving average of the BIS log real CNY (blue line). Also included is the (three month moving average of the) IMF series (red).

Figure 3: Log real trade weighted value of the CNY, BIS (blue), IMF (red). Source: BIS and IMF International Financial Statistics.
It seems apparent that the real CNY is appreciating. The impact on the Chinese trade balance is not yet such that the surplus is decreasing. And in any case, the trade balance is also a function of income levels in China and abroad, as well as relative prices (see this post).
On a slightly different matter, Paulson commented on the IMF’s recent assessment.
In a later interview on Bloomberg television, he took issue with an International Monetary Fund report slashing its 2008 U.S. economic growth forecast to 0.5 percent from 1.5 percent previously and saying the U.S. economy was expected to tip into recession.
“That sounds a little overblown to me,” Paulson said, though he acknowledged that he told Chinese officials “risks are to the downside” for U.S. economic performance currently.
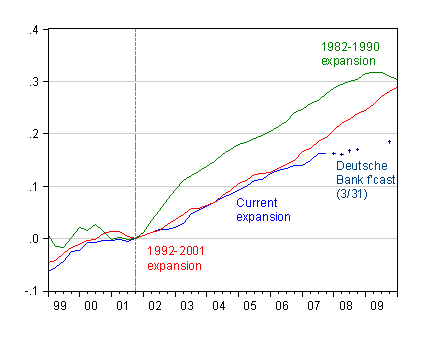
It’s not clear to me what in the IMF report [3] Paulson thought was “overblown” — whether it was the 1.5% growth rate, or the possibility of recession. If it’s the latter, that would seem to be at variance with Bernanke’s testimony (although this would not be the first time the Administration’s view was noticeably different from the Fed’s [4]). Figure 4 illustrates where the economy now stands, what the trajectory is, as implied by Deutsche Bank’s 3/31 forecast, and how that trajectory compares against the previous two expansions.

Figure 4: Log real GDP (Ch2000$), normalized to zero at NBER defined trough, for current expansion (blue), 1992-2000 (red), and 1982-1990 (green). Source: BEA NIPA release of 27 March, NBER, Deutsche Bank Global Economic Perspectives, March 31, and author’s calculations.
Technorati Tags: China,
Renminbi, Chinese yuan,
inflation,
exchange rate,
recession,
Paulson,
Great post I appreciated that it is a little more technical than most here.
Primero!
the absence of broad based nominal appreciation recently in the bis series (and the same result shows up in a simple 40/40/20 $/euro/yen basket) despite the pick up in appreciation v the $ is to me striking. all the real appreciation seems to be coming from the pickup in inflation. in broad nominal terms, the rmb is about where it was at the end of 2005. the fastest nominal appreciation of the rmb (on a broad basis) still came from end 04 to end 05 — and it came not from chinese policy moves but from the dollar’s rebound.
Professor,
Thanks for the post, I like that you are looking at things in a longer time frame than many other blogs.
One question: in the BIS and IMF series of the real value of CNY, what price data were used? I remember you mentioned last December that newer (and better) price data put Chinese GDP about 40 percent smaller than previously thought, indicating higher inflation rates than previous data. So are these two series use the newer data, or old data?
Menzie,
I agree with JS that this is an outstanding post. Thank you for the link to Brad Setser’s comments give the proper context.
The meaning of the term inflation has change over the years and now means price increases rather than currency depreciation. Because of that the 8.7% inflation in China is very misleading. Just as Ireland experienced increased prices when it began its supply side policies this was not caused by depreciation of the currency but an increase in demand for products. The same thing is happening in China. The actual value of the CNY is actually appreciating in real terms.
Contrast this to the situation in the US where we are not experiencing the same price increases but the dollar is falling like a rock.
Setser quotes Martin Feldstein:
Although cutting the Federal Funds interest rate from 5.25% in the summer of 2007 to 3% now contributes to dollar depreciation, this has been aimed at stimulating a weakening economy
Feldstein repeats the old myth of the relationship of interest rates to the value of the dollar. In truth the dollar has begun to appreciate not depreciate as the interest rates have fallen. The greatest dollar depreciation was taking place while interest rates were rising. The best indicator of this is that gold has stopped shooting toward the moon and has actually pulled back.
bsetser: Thanks for the comment. Yes, what you say reminds us all that we need to stay focused on what the dollar is doing, when we talk about the Chinese currency’s moves.
pat and JS: Thanks for the compliments. Re pat‘s query, the deflators used are CPI’s, and is a differently calculated index vis a vis the absolute PPP measures I discussed in this post.
The Bloomberg report made it sound as if Paulson was speaking to the claim that the financial crisis in the U.S. was the worst since the Great Depression.
Prof,
Thanks for the answer.