Nonresidential investment has been increasing until 2008Q1, at which time it essentially stalled (-0.2 ppts. annualized in log terms). On the basis of past historical correlations, what’s in store?

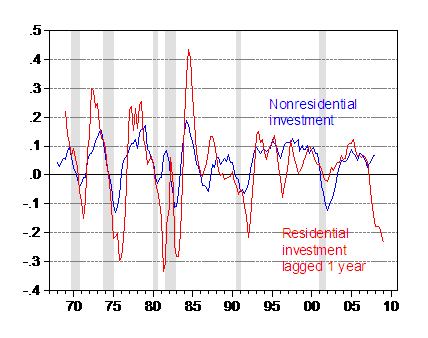
Figure 1: Four quarter growth rate in nonresidential investment (blue) and residential investment (red) lagged one year, calculated as four quarter log difference. Source: BEA GDP release of 29 May 2008, NBER, and author’s calculations.
Figure 1 depicts the time series for year-on-year nonresidential investment growth, and residential investment growth lagged four quarters. There’s an obvious correlation (see e.g. most recently Calculated Risk), but clearly it’s not always a particularly strong one. There are periods where business fixed investment levitates above residential growth, such as the latter part of the 1980s (due to the dollar’s depreciation), and during the 1990s, as well as the most recent few quarters. The relationship can be summarized using a OLS regression of 4-quarter growth on 4-quarter growth rates.
d(nresinv)t = 0.035 + 0.311 d(resinv)t-1 + ut
Adj. R2 0.37, SER = 0.054, smpl 1967q1-08q1, bold face denotes statistical significance at 1% MSL.
Using quarter-on-quarter growth rates yields a similar result (i.e., the cumulative coefficients on four lags of changes in residential investment sum to 0.33, as opposed to the 0.311 coefficient above).
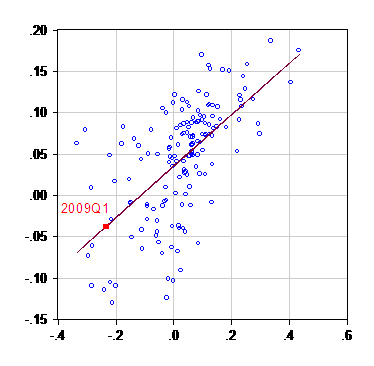
What does this predict for year-on-year business fixed investment growth in 2009Q1? That’s shown in Figure 2.

Figure 2: Four quarter growth rate in nonresidential investment (vertical axis) plotted against four quarter growth rate in residential investment lagged one year (horizontal axis), regression line (purple), and forecast for 2009Q1 based on 2008Q1 data (red square). Source: BEA GDP release of 29 May 2008, and author’s calculations.
The regression indicates a 3.8% 4 quarter decline (in log terms) in 2009q1. It’s unclear to me how this fits in with other forecasts. The q4/q4 prediction I obtain of -2.9% is somewhat less than the 0.3% (non-log terms) decline forecasted by the participants of the Chicago Fed Automotive Outlook symposium [1].
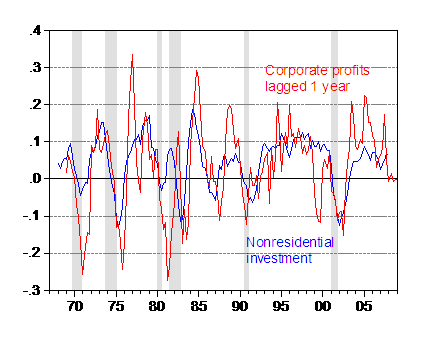
An alternative approach would be to try to explain investment using variables that theory says might be important. As discussed in this post on the investment disconnect, corporate profits is one candidate. In Figure 3, I plot 4 quarter changes in nonresidential investment and in real corporate profits.

Figure 3: Four quarter growth rate in nonresidential investment (blue) and in real corporate profits (red) lagged one year, calculated as four quarter log difference. Real corporate profits calculated by deflating by GDP deflator. Source: BEA GDP release of 29 May 2008, BEA via FRED II, NBER, and author’s calculations.
This relationship,
d(nresinv)t = 0.034 + 0.317 d(cprofits)t-1 + ut
Adj. R2 0.29, SER = 0.058, smpl 1967q1-08q1, bold face denotes statistical significance at 1% MSL.
predicts that the 4 quarter change in nonresidential investment will be about 0.3 ppts. in 2009q1.
In either case — using a lead-lag relationship [2], or one based upon a version of a cash-flow model — investment growth will be slowing down over the next year.
Technorati Tags: nonresidential investment,
residential investment, corporate profits.
I’m sorry but the residential versus nonresidential investment seems like a sun spot versus dow jones correlation. I don’t care what the coefficients say if there is perfect correlation of two totaly unrelated circumstances does it really have any meaning?
Nonresidential investment versus corporate profits does seem to have some relationship.
It seems to me there is a correlation between non-residential and residential, but its not a 4 or 5 quarter lag. Basically when residential is booming, nearly always non-residential is put on hold. Why? for while both are construction there use value is quite different. One is a consumer good – housing etc. – one is a piece of fixed investment which must earn a rate of return.
Hence when residential construction is booming – building materials, labour, etc. are expensive, such that non-residential construction as an investment becomes uneconomic – it doesn’t earn the anticipated rate of return. You also see that when non-residential construction is low, in general there is more investment in other forms of fixed capital i.e. machinery etc.
At present rates of return in non-residential construction, based on rents and rates of occupancy, are high. It is not accident that non-residential construction picked up as residential began to slow. Non-residential will decline when the rate of profit in that sector, which seems to be marginally off its peaks, falls too far.
I think that the lagged correlation makes sense. You don’t need as many strip malls if the housing market has come to a halt. Structures is about 1/3rd of nonresidential investment.
There are good reasons that residential and non-residential construction would be positively correlated. Both are sensitive to interest rates. Both are sensitive to overall economic circumstances. That is no more than to say they are both cyclical. However, they are more closely related than simply through their cyclical nature. New housing means new roads and utilities. New housing often means new schools, retail and service facilities. Planning, finance and regulatory issues often take longer for commercial construction (though roads and utilities tend to be coincident with houses), so there is a lag. Completion also takes longer for some forms of non-residential contruction, which adds to the lag. I’m not sure why anyone wouldn’t expect the two to be correlated, with a lag.
Just for clarification, the observation that residential investment leads, while nonresidential investment is concurrent with, the business cycle did not originate with me. In this post, I quote from Hall and Papell (6/e):
So it’s one of those things that are “textbook”, as they say.
I suggest that you look at three variables.
One is profits as you have done.
the second would be capacity utilization or the GDP gap.
the third would be the cost of capital and maybe the best proxy to capture that would be the stock market. Of course this also contains profits so in a way you are double counting profits.
But I find this threesome does a very good job of explaining nonresidential investment growth.
I’m a little confused as to why you’ve looked at all of business investment. The strongest relationship is between non-residential investment in structures (spending on commercial real estate) and residential investment.
You can make a case for some spending on equipment and software being influenced by housing – particularly construction equipment – but not much.
When looking at non-res investment in structures the best leading indicator is the % of banks tightening lending standards on commercial real estate loans from the Fed’s Senior Loan Officer Survey.
Along the same lines, the % of banks tightening lending standards on C&I loans is a good explanatory variable for business investment in equip. & soft.
Except that there has been a notable trend towards self financing of investment over the last decade. This was part of the reason why investment banks turned so strongly towards consumers as a source of profits after the bursting of the hi-tech bubble.
Loans to business have escaped the credit crunch virtually unscathed;
Nonfinancial corporate sector debt growth barely slowed in the first quarter. Debt has continued to rise relative to output. But interest expenses remain extremely low at about 2% of output, and other measures (debt/net worth and debt/equity) do not indicate excessive gearing.
That said, the widening financing gap is spurring demand for loans. Real nonresidential investment spending growth has slowedit is little changed since early 2006 for these firms. But, at the same time, internal cash flow has been falling. In the first quarter, the financing gap stood at 25% of capex. It was a fairly similar 20% of capex in the first quarter of 2007 but 10% in the first quarter of 2006 and negative in the period of rapid domestic profits growth before then.
UBS p12 US Economic Perspectives 6 June 2008
spencer: A good suggestion. I did something like this (focusing on the capital stock) in this post on the housing overhang, relying on GDP and user cost of capital.
PA: I think Calculated Risk has well documented the link between residential and nonresidential investment; I was interested in total nonresidential investment, since this is important for total economic activity.
Calculated Risk never makes the case for cause and effect between residential and non-residential, but simply assumes that it exists.
We live in a “Brave New World” where correlation proves cause and effect or opinion polls prove the validity of concepts. We have much superficial analysis in our “Brave New World” and with command economies growing stronger and stronger we move more and more toward the inmates running the asylum.
DickF: There’s plenty of theoretical reasons for believing that housing should lead the business cycle. In addition to the citation from a textbook (I suspect you don’t believe in such things), take a look at Ed Leamer’s work on the subject, here. Ed Leamer wrote “Let’s take the con out of econometrics”, and is in my book the father of robustness checking (his specific version is extended bound analysis). May I respectfully suggest that you read a bit more broadly before casting such aspersions. What you take as assumption might be actually based upon a reading of the academic empirical literature.
There’s plenty of theoretical reasons for believing that housing should lead the business cycle.
Sure. Residential investment is indeed normally one of the best leading signs of an impending recession. That does not necessarily mean much if a the slump in residential investment has an unusual cause. As Ed Leamer notes in that paper you quoted: “Housing did not give an early warning of the Department of Defense Downturn after the Korean Armistice in 1953 or the Internet Comeuppance in 2001, nor should it have.”
Indeed, he’s quite right. But for the same reason, a housing slump brought about by particular features of a housing market and bubble may not be as good an early warning sign of a broad recession, either.
John Thacker: I’m not sure I understand your point. While I allow that if there was a bubble (in the economist’s sense of the word), then the housing slump might not presage a broad recession, Still, I don’t see why theoretically it should lessen the likelihood, without knowing more. Indeed, to the extent that housing price declines reflect in part either an increase in the discount rate (due to increasing risk) or because of a constriction of credit due to heightened asymmetric information issues, then I would expect housing prices to signal future movements in GDP.
By the way, take a look at this from Big Picture. I can confirm both the Macroeconomic Advisers and e-forecasting series look like they have passed at least local maxima.