What to make of the different measures of inflation being faced by consumers?
In Figure 1, I plot four measures: the standard CPI-U, the CPI research series, the chained CPI, and the personal consumption expenditure deflator.
Figure 1: 12 month inflation measured as CPI-U (blue), CPI research series (red), Chained CPI (green) and Personal Consumption Expenditure deflator (black), calculated as 12 month log difference. Source: BLS via FRED II, BLS CPI research
chained CPI, FRED II and author’s calculations.
The first observation I will make is that all series are moving upward over the last few months, with the CPI-urban exhibiting the most rapid acceleration. The chain weighted CPI inflation rate is lower, and accelerates less rapidly. This makes sense, because — once again — the CPI uses fixed weights, now updated every two years, while the chained CPI changes weights continuously. [1] (If there were a Paasche CPI, it would be below the chained CPI.)
Second, the personal consumption expenditure deflator shows a pattern very similar to that of the chained CPI, despite the fact that what is measured, and at what prices, differs. Recall, the PCE deflator measures costs of consumer goods and services produced by suppliers, but not not necessarily that consumers face. Think medical care,for instance, where consumers do not face the full costs of the goods and services produced. In addition, the shares of each component differ between the PCE and CPI. These differences are summarized in these charts from a 2006 presentation by BEA’s Brian Moyer.
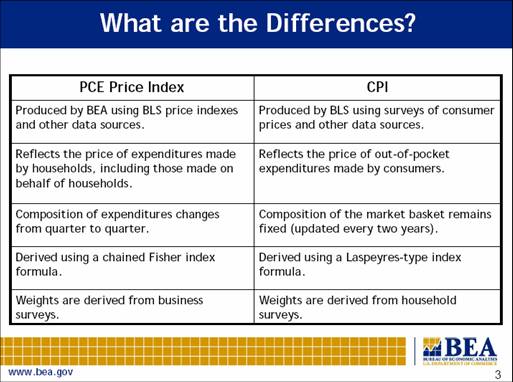
Figure 2: slide from Moyer (2006).
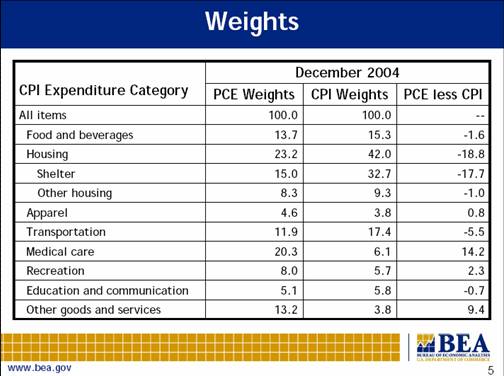
Figure 3: slide from Moyer (2006).
For more on the CPI-U and PCE deflator, see this post from January, as well as this paper. It’s useful to recall that since a lot of imputation has to be done for the prices used in the calculation of the PCE, the PCE is subject to potentially large revisions as more data comes in (see this cautionary note from Fernald and Wang).
What about core measures? Now, before everybody gets into a frenzy about how core measures are a conspiracy to confuse people, I think careful analysts should be interested in core measures to the extent that energy and food have historically been more variable than other components. Whether monetary authorities should target core versus complete, I leave to others to debate. But I don’t think more information can be worse than less, when just looking at the data. Figure 4 depicts core CPI and core PCE over the last few years (for a longer tracking, see this post).
Figure 4: 12 month inflation measured as CPI-less food and energy (blue) and Personal Consumption Expenditure deflator less food and energy (red), calculated as 12 month log difference. Source: BLS via FRED II author’s calculations.
To the extent that some observors are suspicious of how well the CPI measures reflect changes in the inflation rate over time due to methodological changes, one can focus on the BLS research series (which applies the current construction methods retrospectively to past data), or the PCE deflator, which has undergone fewer methodological changes that people seem to worry about. (Note: I do not discuss the “representativeness” of either index — see this post on plutocratic vs. democratic CPIs for that issue.)
The bottom line I take from this: there’s no doubt that inflation rates are rising. And the standard CPI is rising more than the chained CPI and the PCE deflator, in part because of its quasi-Laspeyres nature.
Technorati Tags: inflation,
CPI, personal consumption expenditure deflator,
core CPI, core PCE deflator.
Menzie wrote:
Recall, the PCE deflator measures costs of consumer goods and services produced by suppliers, but not not necessarily that consumers face. Think medical care,for instance, where consumers do not face the full costs of the goods and services produced.
There is another aspect of this that is usually ignored, government subsidy and tax policy. When the government uses tax revenue, through tax deductions or direct subsidy, to target and increase consumption in an economic sector greater than the market desires – such as medical care – that sector will experience both increased demand driving increased supply to satisfy this market dislocation. But additionally a portion of the increased spending will be taken through price increases rather than increased supply. This is obvious when you consider the rate of price increases in government subsidized economic segments relative to general price increases, again consider health care.
Such dislocations can be so serious as to create “bubbles” such as the recent real estate boom then bust that can be so strong as to delay inflation in other sectors. Government policies especially as carried out by Fannie and Freddie artificially increased available mortgage funding in a number of ways, but now the funds flows have slowed to a trickle and inflation is showing itself in other economic sectors.
This also effects “core” numbers. If government policy either restricts or supports those economic segments that are removed to get to the core then a significant amount of inflation is hidden until this “bubble” bursts. Think oil.
And because we have a floating currency such dislocations can be easily exaggerated as inflation ripples through the economy like the rings from a rock thrown into a pool (or the waves from a boulder that has fallen into a lake).
Good post. Thanks!