In my previous post, I discussed how the 2008Q2 advance GDP estimate would be revised, and the possibility that the final figure (after annual revisions) could enter in below zero. One reason that might occur is because the GDP deflator could be revised upward. Suspicion that this might occur is heightened by the seemingly implausible 1.1% SAAR inflation rate recorded for the GDP deflator (see the comments to this post, as well as Felix Salmon, and [0]). One question I want to address is whether this figure is actually so implausible.
I think the answer is no. And the reason is the distinction between the GDP deflator, which measures the price level for goods and services produced, and the gross domestic purchases deflator, which measures prices of goods and services purchased. Specifically, the two price indices pertain to these two concepts, respectively:
GDP = C + I + G + EX – IM
Gross domestic purchases = C + I + G
Where C is consumption, I is investment, G is government spending on goods and services, EX is exports and IM is imports.
To illustrate the difference between the two concepts concretely, consider the following. From the perspective of the household, we as individuals are certainly more familiar with the goods that we’ve spent funds on, as opposed to those consumer goods produced by the US economy, some of which are exported. The prices of those two bundles can obviously differ.
It turns out that over long spans of time, the price deflator for production and expenditures match trends (are cointegrated, in log-levels), but over short periods, they can diverge. And indeed, inflation rates have diverged substantially over the past few quarters.

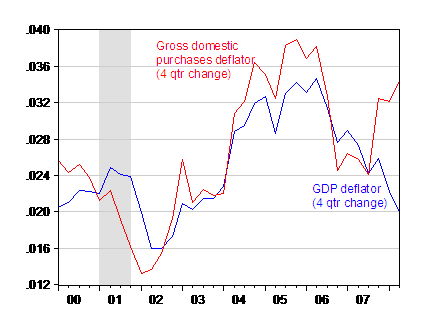
Figure 1: Four quarter inflation rate for GDP deflator (blue) and gross domestic purchases (red), calculated as 4 quarter log difference. NBER-defined recession dates shaded gray. Source: BEA GDP release of 31 July 2008, and author’s calclulations.
Figure 1 highlights how the inflation rate for what we buy has accelerated over rates for what we make. Is this surprising? No, I think it’s a natural implication of the United States running a massive current account deficit that the rest of the world no longer wishes to finance on the (favorable) terms it previously received. Interest rates and the rate at which we trade US goods for foreign goods (both knzn and Stefan Karlsson note the importance of this terms of trade effect) must adjust. As many observers indicated several years ago, if you borrow and consume in excess of production, sometime in the future, you may have to pay back by producing in excess of consumption. That process will be facilitated by a change in the terms at which home (US) goods exchange for foreign goods (see this Council on Foreign Relations special report and references therein). And this is what we are seeing occur now. The credit card bill has come due.
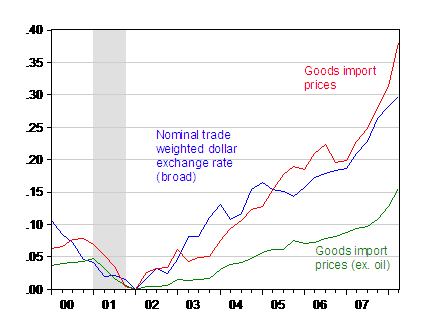
Nor is this a surprise to those who have been following the evolution of tradables prices. Figure 2 shows how goods import prices have moved with the dollar’s decline. Total goods import prices have risen more than the dollar decline since oil prices have jumped up. But even prices of imports ex-oil have risen substantially.

Figure 2: Log level of nominal dollar exchange rate against a broad basket of currencies (blue), goods import deflator (red) and goods import deflator ex oil (green), normalized to 2002Q1. NBER-defined recession dates shaded gray. Source: BEA GDP release of 31 July 2008, Federal Reserve Board via St. Louis Fed FRED II, and author’s calclulations.
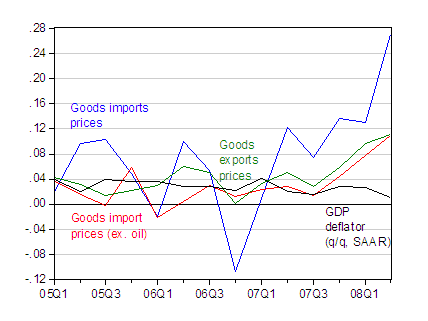
Another way at looking at the divergence between the GDP deflator and the gross domestic purchases deflator is to note the differential rate of inflation for the tradables (goods imports, imports ex. oil, exports) and the GDP deflator. That is shown in Figure 3.

Figure 3: Annualized quarter-on-quarter inflation rate for goods imports (blue), goods imports ex oil (red), exports (green), and GDP deflator (black), calculated as log first differences. Source: BEA GDP release of 31 July 2008, and author’s calclulations.
Thus, it seems to me that we should anticipate that over time, we should continue to see a disjuncture between the GDP deflator, and what we think should be the price level.
This is not to deny the possibility that the GDP deflator might be revised upward. That could happen. But my view is that a lot of the puzzlement abounding can be resolved by recognizing the difference by the GDP deflator and the gross domestic purchases deflator.
Technorati Tags: inflation,
recession, GDP,
gross domestic purchases, exports,
imports.
This paper provides a critique of the way NIPAs are computed such as with the calculation of real GDP, and this paper also argues that imports should be removed from the GDP deflator:
http://papers.ssrn.com/sol3/papers.cfm?abstract_id=501363
Does anyone else agree that imports should be removed from the GDP deflator?
You might want to toss in a numerical example, just to make all of this clear. C includes traded goods, including oil. The US produces over 40% of the oil it consumers, so the prices of IM doesn’t account for all of oil price fluctuation. So the GDP deflator is ex-something relative to the gross domstic purchases deflator, but your description leaves unstated what that ex-component might be and why it allows one deflator to be accelerating and the other decelerating when both contain traded goods. You have suggested how having two deflators leaves room for the divergence, buy not any specifics to allow that notion to stick in the mind.
I have major problems with using import prices because so much of imports besides oil are raw commodities for example industrial supplies excluding oil account for 17% of imports.
Roughly, final products — capital goods, autos & consumer goods — only account for just over half of imports. In period like we have now industrial commodity prices soar and the changes in the dollar relative to changes in commodity prices is very small. On the other hand prices of imported final products track much closer to domestic prices.
Over the past year import prices rose some 20%.
but capital goods were up around 2%, autos around 3% and other consumer goods 3.7%. In contrast industrial supplies were up 50%. But outside of energy these industrial supplies have a very small weight in final product prices.
Moreover, it looks like retailers are absorbing much of the rise in consumer goods prices as the deflator for GAFO prices — retail excl. food, fuels and autos — are still falling.
The weighting of import prices is so different from the weighting in domestic price indices that it creates major problems.
https://www.ftportfolios.com/Commentary/EconomicResearch/2008/8/4/gdp_report_mis-underestimated
There is a good explanation on why the govt. used 1.1% GDP deflator instead of 4% in the link.
Excellent explanation. Most of the same differential effects explain why the CPI and the “core” inflation rate are so out of whack.
ic, thanks for posting that First Trust link because I learned some new things from it. I also learned from this paper which uses the model of Chauvet and Hamilton that the growth rate of gross domestic income (GDI) deflated by the GDP deflator does a better job of predicting the start of recessions than does the growth rate of real GDP:
http://papers.ssrn.com/sol3/papers.cfm?abstract_id=982578
A “reality check” on the GDP deflator is to ask, “what’s happening to services inflation”. Obviously, once you strip out the impact of import inflation, what’s left to measure should be heavily weighted towards services. The two biggest components of services — medical and shelter — have been inflating in the CPI by about .2-.3% monthly. I’d imagine between them they constitute about 50 of the CPI, and probably 65% of the CPI ex-imports.
So, saying the deflator is reasonable at 1.1% for the quarter is like saying services inflation is running about that level.
Sound reasonable?
http://www.financialsense.com/stormwatch/2005/0624.html
If you read this, you’ll see where the 1.1% GDP Deflator comes from.
Rob Salzman, that article is about the CPI, which is a totally different calculation from the GDP deflator. I could understand where you might have thought otherwise, since your article includes the statement:
The CPI is not used in the calculation of GDP. I recommend you get your economic insights from people who know this.