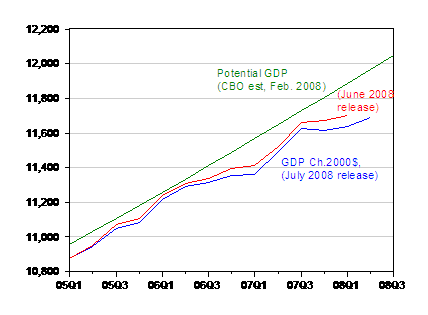
The 1.9% SAAR growth rate in 2008Q2 [BEA] is widely viewed as a positive [0]; and the fact that GDP growth remained, in this advance release, above zero is a positive. However, when taken with the annual revision, one sees some interesting aspects. Not only was growth in 2007Q4 negative, albeit slightly; the revisions put 2008Q2 real GDP below what the final estimate for 2008Q1 GDP was: $11692 versus $11701. Future revisions will definitely occur to the 2008Q2 figure, and indeed the figures back to 2006Q1 will be again revised come next July.

Figure 1: GDP in billion Ch.2000$ SAAR, from July 31 2008 release (blue), from June 26 release (red), and potential GDP, from CBO February estimates. Source: BEA and CBO Update of CBO’s Economic Forecast (February 2008), data [xls].
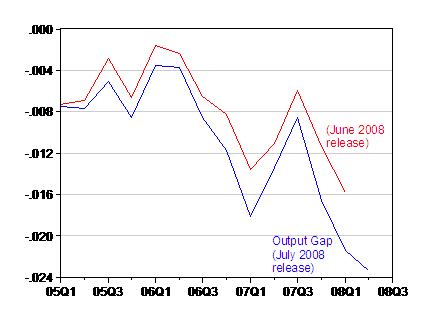
Even with the growth of 1.9% in 2008Q2, the output gap has widened to -2.3%, in log terms. Of course, given the malleable nature of these estimates (on both the GDP and the potential GDP sides) [1], one should not put too much store in these exact figures. What is true is that the longer sub-par growth continues, the more negative the gap will become.

Figure 2: Output gap (measured as log deviation from CBO potential), from July 31 2008 release (blue), from June 26 release (red). Source: BEA, CBO Update of CBO’s Economic Forecast (February 2008), data [xls] and author’s calculations.
Finally, these revisions illustrate the point I have made on the past: around local maxima, GDP estimates will typically be revised downward [3] [4] (as they are going from the June 2008 to July 2008 vintage).

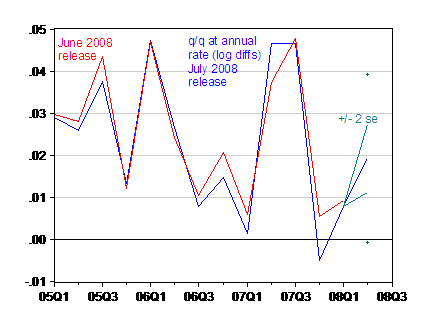
Figure 3: Annualized rowth rates calculated as q/q log differences, from July 31 2008 release (blue), from June 26 release (red), and +/- 2 standard deviations of revisions from advance to preliminary (teal lines) and +/- 2 standard deviations going from advance to latest (green pluses). Source: BEA.
Note that Q2 GDP growth could plausibly be revised anywhere within the teal cone (that is, within the +/- 2 standard error band), going from the advance to the preliminary release. One easily observes that this cone does not encompass zero growth. However, as the release notes, revisions to GDP going from advance to latest exhibit standard deviations of 1 percentage point. The +/- 2 standard deviation band (marked by the +’s) does encompass zero…which is why I don’t title posts with unequivocal conclusions like this.
See related posts on this topic by Felix Salmon and Michael Mandel.
Thanks for this post, and here are two questions:
Does the difference between permanent versus transitory shocks to GDP matter for forecasting or revisions?
Do revisions affect subsequent economic performance? For example, if GDP data is revised downward then perhaps firms are less willing to hire.
It strikes me that “Not only was growth in 2007Q4 negative, albeit slightly.” may not be a complete sentence. Obviously, it does not detract from your analysis.
Thank you for your timely insights.
Kimo
Does anyone know why most revisions are downward? Do revisions, for example, show the lag between the data and the economy so that they are upward in good times and down in bad?
Walter Wessels: Around local minima, GDP estimates would understate. See this post.
Charlie Stromeyer: Good question. I don’t know if anybody’s done any work on this subject. In work with Yin-Wong Cheung, we found that ASA-NBER forecasts are more likely to be cointegrated with final estimates than advance. See this paper [pdf].
kimo: Thanks, will fix — grammar was never my strong point.
any comments on the deflators the real GDP estimate uses (2.3%!)? With a more realistic estimate of inflation, even the official CPI (4%), the US is in a severe recession.
A naive question: why is the deflator used to “fix” the GDP number different from the CPI that’s used to fool the public?
Taylor Rules, Exchange Rates, and Speculation About the Dollar/Euro Rate
Menzie Chinn submits: As Europe teeters on the edge of recession [0], and the United States remains mired in slow growth, expectations of what interest rates, and hence exchange rates, are shifting. Here’s a familiar depiction of where policy rates in the
A simple explanation on why GDP deflator is different from CPI:
They are different because essentially they are measuring different basket of goods.
CPI is is a price index of a basket of comsumer goods, while GDP deflator can be thought of as a price index of a basket of comsumer goods, government goods, capital goods and imports & exports.
Anonymous: I’ll have a more extensive discussion in a couple days.
sinic: TNL has the answer. To that I would add that the CPI is a base-year weighted index (see this post), while the GDP deflator is a chain weighted price index. I would also note that the GDP deflator pertains to goods and services produced in the US, which will differ from what goods and services we spend on, some of which is imported (which is related to the issue anonymous mentioned.
A big factor in the difference between the CPI and the PCE deflator is the treatment of housing.
In the GDP numbers housing is the imputed value of the current consumption of the housing stock — much like depreciation in business accounting. So the deflator for housing is a very long, multi-period, lagged function of past increases in home prices while in the CPI they use the home owners equivalent rent.
In the GDP numbers the deflator is frequently distorted when you experience large increases in import prices because they are subtracted when computing GDP.
If you compare the CPI excluding housing to the PCE deflator you see that they track very closely.
Thanks Spencer!
Your remark was “Right On”.
Spencer: you are half right. The CPI and PCE deflator assign different weights to shelter, but they both use rental equivalence. Two good source of additional information are http://www.bls.gov/osmr/pdf/ec020100.pdf
and
http://www.bls.gov/opub/mlr/2006/09/art3full.pdf