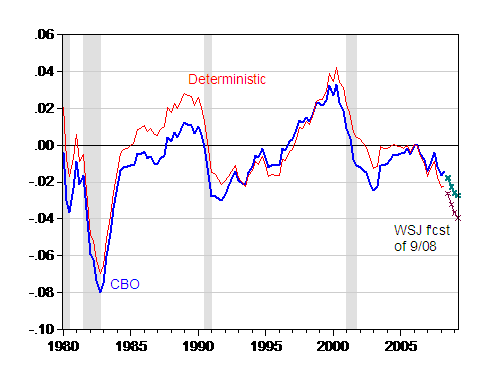
In “Redefining Recession”, The Economist discusses some of the difficulties in interpreting the “R” word. Since the article juxtaposed output gaps against the conventional NBER definition, I thought this would be a good time to update my post on output gaps, using the latest GDP data, CBO estimates, augmented with the latest WSJ survey of forecasters.
Figure 1 depicts in blue the output gap as defined by the August 28 GDP release and the September 9 CBO estimate of potential GDP. I’ve added the deviation from a quadratic time trend in red.

Figure 1: Actual output gap defined as deviation from CBO potential GDP (blue) and from quadratic in time (red); corresponding measures as implied by the September 2008 WSJ survey of forecasters, in teal and maroon, respectively. NBER defined recessions shaded gray. Source: BEA GDP release of 28 August; CBO Budget and Economic Outlook: An Update (September 2008), Table 2-2; WSJ survey of forecasters (September 2008); and NBER.
What this graph illustrates is that the rapid 3.3% growth recorded in 2008Q2 barely made a dent in the output gap. Using the WSJ mean forecasts from the September survey leads to the conclusion that the output gap will be nearly 3% (log terms) by 2009Q2, using the CBO measure of the output gap potential output. It will be 4%, measured as a deviation from a quadratic in deterministic trend.
Technorati Tags: potential GDP,
recession, output gap,
full employment output, trend, and
forecasters.
The Economist article you reference proposes unemployment as a useful measure of recession for the U.S. because a) that is the way the citizen sees it and b) employers in the U.S. are much quicker to terminate employees as compared with Europe c) unemployement data are more timely and revised less.
They also like the output gap measure but say it is devilishly difficult to construct. Looking at your construction, this graph should be very useful for a person studying business cycles.
Your reaction?
Isn’t this thread interesting? No comments. No slime trails leading from under the rock. No ranting lunatics.
Why? Professor Chinn produces a great graph on a major issue that is highly suitable for econometric analysis and rational debate. But…there is no suggestion of relevance to the current political cirque d’imbeciles. Bush doesn’t feature as the anti-Christ. Nor does secular salvation through Obama or persons unknown.
Result? Silence.
You may not have noticed, but there is a high-stakes game of chicken being played between Wall Street and Fed/Treasury over bailing out Lehman. If no one blinks, Lehman will fail and Monday will be very interesting for AIG, Merrill, and possibly the whole financial system.
It’s too bad Sarah Palin hasn’t commented on it, or Menzie would be all over it.
W. Raymond Mills: While there are reasons to favor the unemployment rate, especially since there are “real time” drawbacks to using the output gap (see comments to this post, and in particular SvN‘s trenchant critiques), I am wary.
So, the case for using the unemployment rate, as opposed to the NBER approach of looking at 4 key indicators plus a monthly GDP series as an ancillary measure, is not a “slam dunk”.
Mr. Chinn
Thank you very much for your explanation. Makes sense to me and is a needed corrective to the Economist position.
Apparently, more than one idicator would be useful for different time periods and different causal scenarios. The BEA chart of profit over profit plus costs per unit of non-financial firms started trending downward after 1997, long before the 2001 recession. Alas, did not predict our current slow-down. But still may be useful in more “normal” times, when the financial sector is not the sole cause of the decline.
Did other “leading indicators” predict the current problems?
Would be nice to have some leading indicators of where the economy is going, some intermediate indicators (perhaps unemployment) and some final indicators for use for after-the fact analysis.
Welcome back, Menzie. I’ve enjoyed your posts on the Taylor Rule and this one on Output Gap, which are up to your usual high standards.
Menzie:
Here is a question I have had about the output gap I hope you can answer: could a large, positive aggregate productivity shock lead to a negative output gap? Such a shock would increase the productive capacity of an economy. To the exent this productive capacity increased faster than the economy’s utilization of it, there would be slack and thus a negative output gap. If my story is correct–and I not sure that it is–then the negative output gap in this case would be less alarming, if at all, compared to a scenario where productive capacity is steady but utilization drops. For this reason, measures of the output gap and their uses (e.g. in Taylor rule) could be problematic in evaluating the state of the economy.
David Beckworth: If expectations are rational, and there are no rigidities, then a simple intertemporal model would predict that consumption would rise in anticipation of that higher future expected output (of course, why you’d care about the output gap in such a model is another question). Add in investment, adjustment costs, etc., then harder to say. You’d need a DSGE with your preferred rigidities built in. Then there’s a question of whether the analysts would recognize the shift in potential output using real time data; if they didn’t then they’d mismeasure the output gap.
Why is GDP not adjusted for inflation? The adjustment is not a difficult one.
Mitchell Wachtel: It is; in the above discussions, we’re using “GDP” in place of “real GDP”.
Menzie Chinn: Many thanks. How does one characterize unemployment for a year, given that rates are listed by months?