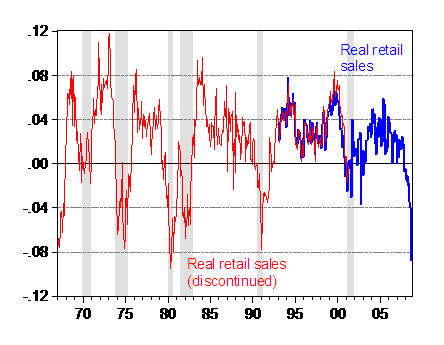
Here’s a picture of 12-month percentage changes in real retail sales. Certainly unprecedented for the current series, not so much when including the previous (more volatile) discontinued series — although you do have to go back to 1980 to see a bigger 12-month drop.

Figure 1: 12 month change in real retail sales series RSSFS (blue) and discontinued series RSALES (red), calculated as 12-month log differences. October 2008 observation is calculated using nominal retail sales divided by CPI assuming 0 m/m inflation in October. NBER-defined recession dates shaded gray. Source: St. Louis Fed FREDII, NBER, and author’s calculations.
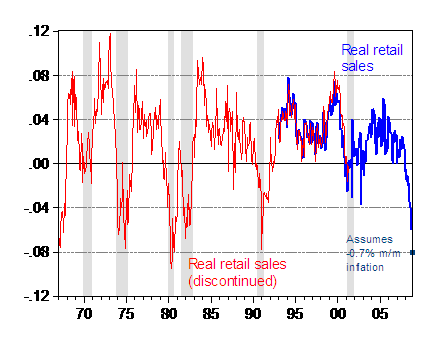
[Update, 11/15 11am Pacific] Additional graph allowing for consensus m/m inflation in 2008M10 of -0.7%.

Figure 2: 12 month change in real retail sales series RSSFS (blue) and discontinued series RSALES (red), calculated as 12-month log differences. October 2008 observation (teal square) is calculated using nominal retail sales divided by CPI assuming -0.7% m/m inflation in October, which is consensus according to Reuters (11/14). NBER-defined recession dates shaded gray. Source: St. Louis Fed FREDII, NBER, and author’s calculations.
Technorati Tags: recession, retail sales,
inflation, and consumption.
does this change your “back of the envelope” calculations for consumption from the other day? i found those interesting. been a long time since my econ undergrad classes (for what that is worth) but i’ve been trying to frame this in terms of the gdp function and thinking that until we know what the new “C” is we won’t know much.
Menzie I hate to be cute (I have held my tongue through some other recent posts) but could you give us the econometric formula that predicted this drop in retail sales.
Also did the drop in retail sales preceed the drop in the economy (Keynesian) and cause unemployment or did the drop in sales follow the drop in production and employment (supply side)?
oops: Since I was looking at a short to medium horizon, rather than a “real time” very short horizon, the retail sales results don’t change my views much. My earlier post on consumption relied upon reversion (that’s the “error correction” framework) to long run ratios of consumption-to-GDP and consumption-to-wealth and the real interest rate.
DickF: I don’t claim to be a time series econometrician versed in modeling all variables. I’m sure if you perused the academic forecasting journals (e.g., Journal of Forecasting), you’d find some relevant articles; I’m sure they’d mispredict.
In answer to your question — I don’t know. One would have to look at the inventory data. I do take issue with your simple equation of Granger causality with Keynesian or supply side interpretations. With forward looking expectations, I don’t know how one would discern between the two approaches.
Using the old BEA real retail sales data the worse y/y drops were -7% in 1974 and -6% in 1980 as compared to the current observation of about -8%.
So this appears to be the worse y/y drop in the post WW II era.
Can anyone tell me why the BEA stopped reporting real values for retail sales? Also, I have seen mulitple deflators used to get a real number and am not sure which is the best. The total CPI includes services, so it may not be appropriate.
More and more, it appears that the 1990-91 and 2001 recessions did not clear enough of the detritus out, and things are finally catching up with us.
Note that today, several retail products are Moore’s Law deflationary (PCs, Flat-Screen TVs, hard drives, digital cameras). These products did not exist in 1980-82.
So for electronics, retail revenue only sustains when new products with better capabilities arive. Absent that, revenue shrinks even though consumers are getting ever-more ‘value’ from $100 worth of electronics each year.
GK, I’m not sure what you are saying here. ‘Agree that a case can be made for deflation in retail electronics. Are you complaining that the official registry of these electronics is somehow defective?
That the 25 MP camera is not 5 times the 5MP camera? That overall, the electronic product tally is registered incorrectly (sky high)?
Ok, I will then…it seems to me that computers got (still get?) very special treatment…the overall effect being to pump up GDP, yes? Helping the case for: the US is the Best Place to Invest
Sorta.
This has to be the first log graph from Menzie that has not taken the sawtooth out of the raw data…retail sales must be wickedly volatile.
It seems to me that this is a classic case of the a graph being behind the curve.
Prices of imported goods to the US fell by -4.7% in October, the largest fall ever.
17% of the fall in retails sales was as a result of cheaper gas (although a proportion was also as a result of less consumption), excluding the fall in gas then retail sales declined by -1.5%.
For the 3rd quarter the price per barrel averaged $113, for the 4th quarter so far it has averaged $69 – and surely its only going to decline from here?
In other words isn’t the US already experiencing the early effects of deflation, which is offsetting rather than exaggerating the decline in consumption?
bill_j: I have recalculated the 12 month change for 2008M10, using the Reuters reported consensus for October m/m inflation, and displayed the results in Figure 2. With respect, I do not see how the picture has changed in qualitatively or quantitatively significant manner.
Thanks, I wasn’t suggesting btw that there wasn’t a sharp decline in retail sales, just that it was being increasingly offset by deflation.
I think your second graph puts that into context, rather than being the greatest fall since the 1960s, in fact it is not yet at the level of the 1992 recession.
Given that there is a lag between the full effect of raw materials prices falls and their impact on inflation, as the crash in commodities only happened in September/October and it will take some time before this impacts significantly on producer prices, it seems to me that this will become increasingly important in the next weeks/months.
Ed Harrison at Credit Writedowns blends the earlier and later data sets and makes other adjustments to come up with a YOY look at retail sales trends back to 1968. He comes up with pretty much the same observations you do; enough so that I consider it confirmation. Here’s the link:
http://www.creditwritedowns.com/2008/11/retail-sales-belated-look-at-fridays.html
bill_j: I think there are two points in your message. The first is whether conditional upon the release of the nominal retail sales number CPI inflation comes in as negative or positive. Negative inflation, conditional upon the sales number, then results in less a decrease in real sales.
However, there is a second point. The decreasing price of consumer goods will mute the decrease in real consumption under some strange consumption function which depends on nominal prices, or if the relative price of consumption is declining. A look at the 2008Q3 advance release data on the consumption deflator vis a vis GDP deflator reveals the relative price is still increasing (thanks for inspiring me to look at this series).
If we see the nominal price of consumption goods trend-decline, in an intertemporal optimizing framework, this might induce people to delay consumption of nondurables and durables, effecting in a behavioral sense a magnification of the downturn in retail sales.
Terry: Thanks for the lead. Doesn’t look like Ed Harrison reconciled the series, just spliced the nominal series adjusted by CPI-all.
Well yes, but I’m not sure I’d call it strange!
The 3rd quarter saw the start of the collapse of raw materials prices, yet if you take the average for the entire quarter it was $113/barrel, compared with $114/barrel for the 2nd quarter, hence oil expenditures actually increased, albeit marginally.
In contrast in the fourth quarter oil is coming in at an average of $69/barrel and will only fall. (figures from the IEA)
This fall has been mirrored in all other raw materials. So what will that do? It will reduce the price of manufactured commodities and expenditures directly on raw materials, so increasing effective demand.
Hence with deflation, retail sales could fall, but if deflation is large enough (not yet the case) this could be an increase in real consumption.
How far this will cause consumers to put off purchases is moot in my view. There has been deflation of manfuacturing production for the last decade at least, this hasn’t lead to a decline in purchases, but rather rampant consumerism and importantly an increases in purchases of services, i.e. commodities which are produced as they are consumed. I’m guessing people won’t wait to go out for dinner on the grounds it might be cheaper next week!
This is a stark example of aggregate economics. Walmart profits up 10%. I just talked to a friend who normally shops in up-scale stores. This weeked her family spend $200 in Walmart. Aggregates actually do little more than obscure what is actually happening. Those interested might I suggest you look at the Cantilln Effect.
Thank is “Cantillon Effect”