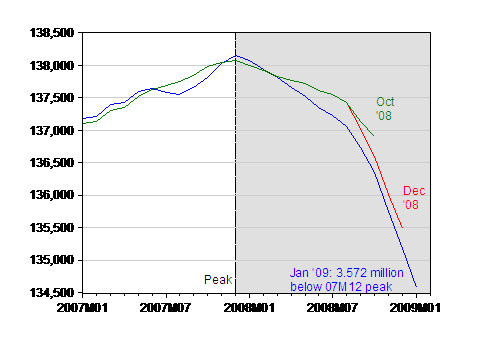
Looks pretty bad to me — especially after taking into account downward revisions for December. Not too good on the output side either.

Figure 1: Nonfarm payroll employment, seasonally adjusted, various releases. NBER defined recession dates shaded gray (assuming recession has not ended by 2009M01). Source: BLS, employment situation, various releases, via St. Louis Fed FRED II.
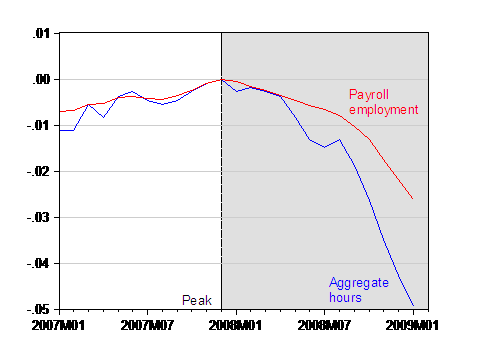
Looking at hours worked provides a slightly different perspective on the change in the employment situation (not necessarily a prettier picture, though).

Figure 2: Log Nonfarm payroll aggregate weekly hours (blue), and Log Nonfarm payroll employment (red), seasonally adjusted, normalized to 0 in 2007M12. NBER defined recession dates shaded gray (assuming recession has not ended by 2009M01). Source: BLS, employment situation, January release, via St. Louis Fed FRED II, and author’s calculations.
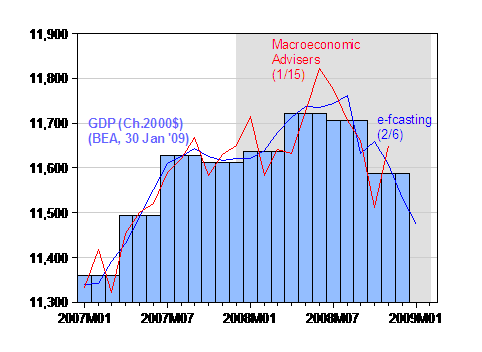
We also now have a first (unofficial) reading on output in the new year.

Figure 3: GDP (light blue bars), GDP from e-forecasting, 2/6 (blue), and from Macroeconomic Advisers 1/15 (red) in Ch.2000$, SAAR. NBER defined recession dates shaded gray (assuming recession has not ended by 2009M01). Source: BEA, GDP release of 23 December, e-forecasting 1/9 and Macroeconomic Advisers [xls] 12/16 release.
For now, the downward trajectory in output seems to be continuing.
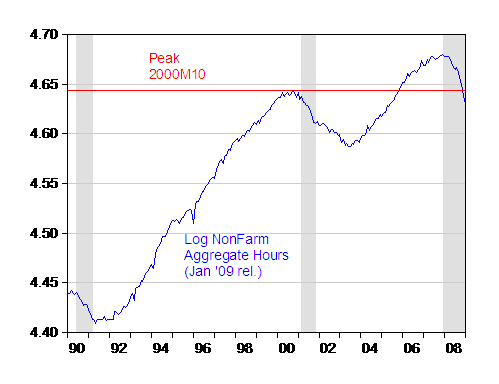
Update: 2/7 12:40pm Per GK‘s request — we are 1.26 percent (log terms) below the peak aggregate hours recorded in 2000M10.

Figure 4: Log Nonfarm payroll aggregate weekly hours (blue), seasonally adjusted, and red line at 2000M10 value. NBER defined recession dates shaded gray (assuming recession has not ended by 2009M01). Source: BLS, employment situation, January release, via St. Louis Fed FRED II, and author’s calculations.
Technorati Tags: nonfarm payroll employment, recession,
hours worked, job loss, GDP.
Like last month, aggregate hours worked continues to drop faster than employment – meaning businesses can’t terminate employees as fast as the work disappears. We will see increasing pain in the February and March employment reports.
“Like last month, aggregate hours worked continues to drop faster than employment – meaning businesses can’t terminate employees as fast as the work disappears. ”
Or rather, people are losing jobs in the private sector, due to the higher taxes being used to employ people in the public sector. Since public sector employees don’t actually do much real work, the hours worked is dropping faster than the number of jobs.
GK: What higher taxes have been implemented in the last three months…? I guess the next time I see a fireman, I’ll tell him/her that he/she is not doing real work, according to GK. By the way, do you still stick to your view that the economy will start expanding in mid-09, as you indicated in your comments from 20 January?
Presumably this is good news because according to GK “the slope of job loss is steepening, which means a bottom is near!”
Menzie,
Econbrowser’s own article from December 2008 features the Dueker analysis saying that the recession ends in July or August.
So I will only be wrong if your featured Dueker is also wrong.
Note that I said ‘expansion’. That does not automatically mean ‘boom’. An expansion can also be a jobless recovery (as Dueker also predicts).
Public Sector : CA Sales tax is set to rise, and State Tax will soon follow. Surely even you won’t claim that the California state payroll is not bloated. Or that public sector payroll has increased by 50% in the last 20 years. Or that public sector jobs and benefits have grown at a rate the private sector can hardly imagine.
Plus, we have learned that Democrats are exempt from paying taxes. This is why they want to raise taxes on others – to make up for their nonpayment. If I vote Democrat, can I get the tax waivers that Geithner/Daschle/Rangel enjoy?
“according to GK “the slope of job loss is steepening, which means a bottom is near!”
That is always how it works. Research all prior recessions.
Are you suggesting that the opposite is possible – that job losses continue to steepen into a vertical singularity that makes job losses double each month, so that the next 5 months lose 1m, 2m, 4m, 8m, 16m, 32m, and finally 64m jobs, so that by August, the US economy has zero jobs?
Look at how high Productivity Growth was in Q4, even with the large GDP contraction. A productivity surge sustained over 2-3 quarters always leads to job growth 6-9 months hence.
Interesting reaction the market had to the miserable jobs report this week. I wonder if money will start coming in to stay ahead of the recovery.
GK: Almost all smooth functional forms will have points of inflection where there’s a deceleration in reductions. However, in order for your categorical assertion to have empirical content, it must be that the biggest percentage decline is just before the last month of recession. A casual inspection of post-War record indicates that your characterization certainly doesn’t fit the mid-1970s and 1980’s recessions (using NBER defined turning points). The maximal negative percentage growth rates are several months before the recession-ends. In making these comparisons, I have used the latest vintage NFP series and the NBER definition of cycles.
“Almost all smooth functional forms will have points of inflection where there’s a deceleration in reductions. ”
Yes, and from Figure 1, we are already seeing a deceleration in the magnitude of downward revisions, which precedes a deceleration in reductions.
“The maximal negative percentage growth rates are several months before the recession-ends. ”
This is what the Duekar analysis also shows, and which I am merely following. I see you have not stated whether you agree or disagree with the Duekar analysis, which Econbrowser posted less than 60 days ago.
I also point out that Productivity growth has decoupled from GDP on the positive side, which is also an indicator that precedes recovery by 6-9 months.
I maintain that we will have a Q309 recovery (although a jobless one). Employment will bottom at about 131M jobs (3.5M more lost from now).
Can you extend the aggregate hours chart back for 10 years? I want to see if we are presently below the peak from 2000-01. It would be a major point if aggregate hours are below the peak from even 9 years ago.
GK: I have great respect for Deuker’s work, but two month’s worth of data have come in since that post. In particular, estimates of ABS losses have risen over time, implying — for a given level of capital injections — greater restraint on lending.
In regard to decreasing size of downward revisions, you have to be careful as some are benchmark based, and some are not. The January numbers are based upon a benchmark revision, and hence that revision is not comparable to previous ones.
You have your graph now (Figure 4) in the post. We are 1.26% (log terms) below the 2000M10 level of AWHI. For future reference all these labor data series are available at FRED II.
Does ‘Q309 recovery’ mean ‘trough in June or earlier?’ I’d bet against that. “Trough in September or before” seems possible, though at even money I’d probably still bet against it, mainly because of the bad theater coming out of Capitol Hill.
“I have great respect for Deuker’s work, but two month’s worth of data have come in since that post. ”
But the job losses are relatively close to Dueker’s estimates so far. Restraints on lending may or may not last that long.
“Does ‘Q309 recovery’ mean ‘trough in June or earlier?”
No, the trough is in Q309. July or August.
Thanks for the hours graph. It seems that the 2001-03 downturn was quite severe when hours are taken into account.
I believe that stock market bottoms happen at times that are very close to when peak hours bottom. That was certainly the case in late 2002.
GK:”Look at how high Productivity Growth was in Q4, even with the large GDP contraction. A productivity surge sustained over 2-3 quarters always leads to job growth 6-9 months hence.”
Q4 productivity is quite misleading because job losses were so acute and severe around that time. In a service economy, much of Q4 output is in reality negotiated prior to actually being booked. If jobs losses happen rapidly, labor productivity is bound to spike.
Once could argue that for the last 9 years, we already have been in a ‘Great Depression’ equivalent event that happens once every 60-70 years. I don’t think there is any other period in the last 60 years where hours worked are effectively flat over a 10-year period.
Menzie-
When comparing job losses to prior recessions we see that the picture is not that grim on a relative basis. If we adjust for the labor force today we are better off today than in the 70s.
Further I would look at the productivity numbers to gauge economic activity. The assertion that productivity is misleading is itself a misleading assertion. We see that wage increases followed logically with changes. We need a micro read to make a clearer assertion.
I would also suggest that we have NEVER known when we would come out of a down turn. There are no theories or models that offer ideas on this front. A major weakness of Macro.
Finally, we need to disavow ourselves of “Keynesian” stimulus notions. They simply do not make sense given price theory and expectation theories. We can relax both quite a bit and still conclude stimulus is not an answer to inappropriate resource allocations.