The WSJ survey of forecasts has just come out [link]. One key finding is that the mean forecast has barely budged since March. In other words, unlike previous months, the perceived outlook has ceased deteriorating.
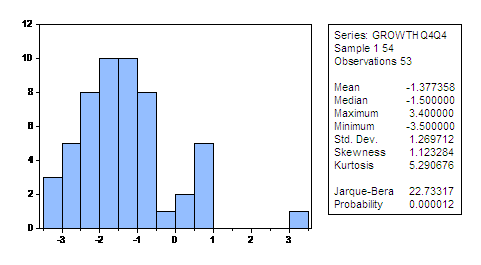
That being said, the dispersion of forecasts is pretty high, even q4/q4, ranging (-3.5%, 3.4%).

Figure 1: Histogram of 4q/4q growth rate of real GDP (in percent) from March WSJ survey. Source: WSJ April survey and author’s calculations.
One is tempted to ask who is forecasting 3.4%. That would be James F. Smith, of Western Carolina State University and Parsec Financial Management. Dr. Smith has been extremely consistent in his forecasts for q4/q4 growth, having forecasted 3.4% in the December 2008, as well as in the January, February and March 2009 surveys (I didn’t go further back than December…). Note that once his forecast is removed, the distribution of the survey responses is approximately Normal (i.e., a Jarque Bera test can’t reject the null of a Normal, at the 43% msl). In addition, the mean growth rate drops to -1.48%.
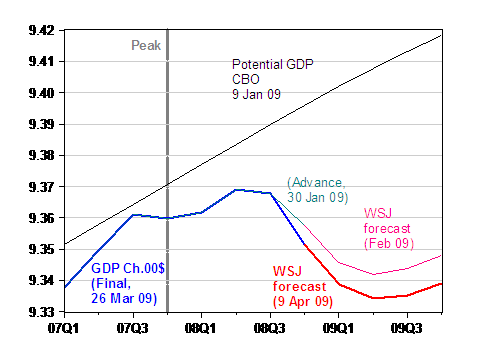
I noted in the first paragraph that the mean forecast had ceased deteriorating. One can see this if one plots the March and April mean forecasts. The forecasted trajectory of GDP is essentially unchanged. One has to go back to the February forecast to see the detioration, as is shown in Figure 2.

Figure 2: Log real GDP (blue), April WSJ survey mean forecast (red), real GDP advance (teal), February WSJ mean forecast (pink), CBO potential GDP (black), all in log of Ch.2000$. Source: BEA GDP final and advance releases, WSJ, CBO, NBER and author’s calculations.
In this sense, the statements by several individuals that the outlook has stopped deteriorating are consistent with forecasters’ views. [0] [1] However, this is not the same as saying economic conditions have stabilized. In fact, the mean GDP forecast still indicates continued decline into 2009Q2. And of course, means by definition do not show the variance in forecasts.
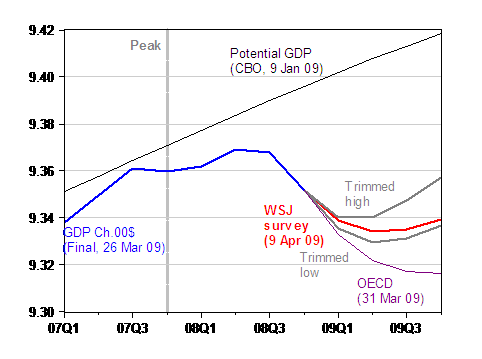
Because of the aforementioned sensitivity to outliers (I’ll call it the James Smith problem), I’ve plotted in Figure 3 (log) real GDP, the mean WSJ forecast from the April survey, and trimmed high and low forecasts (that is, looking at the 6th highest and 6th lowest q4/q4 forecasts; thus I’ve dropped the top 5 and bottom 5, out of 54 forecasts).

Figure 3: Log real GDP (blue), April WSJ survey mean forecast (red), trimmed high and trimmed low forecasts (gray), CBO potential GDP (black), all in log of Ch.2000$. Source: BEA GDP final release, WSJ, CBO, NBER and author’s calculations.
The mean forecast implies that the output gap will be -8% (in log terms) in 2009q4. If the optimists are right, then the output gap will only be -6%.
The survey was conducted between April 3-6. Thus, they came before the trade release for February. Since the trade balance was above consensus, conditional nowcasts of GDP have probably risen [2].
On the other hand, the OECD forecast cited in this post implies continued decline throughout 2009. I’m not certain why the OECD is so gloomy (or alternatively, why the US-based forecasters are so optimistic). Using the OECD forecast and the CBO potential, the output gap will be 10.9% (log terms) by 2010q4. Perhaps this is in part due to a more pessimistic assessment of potential GDP (eyeballing the “Output Gap” table in Appendix 1.2 of the March OECD Economic Outlook, it seems that the OECD’s estimate of potential is about 1.2% less CBO’s).
A final observation: given the substantial negative output gap under reasonable assumptions, it’s hard for me to be particularly worried about inflation in the current year, as evidenced in some fevered accounts (e.g., [3]). Given that 0% of respondents perceived inflation as the biggest threat to their forecast, I think I’m in good company. (Digression: in 2000-01, when I was following the Japanese economy on the CEA staff, I also heard worries about hyperinflation in the wake of rising debt-to-GDP ratios; so far we haven’t seen that outcome materialize).
Technorati Tags: recession, GDP,
inflation,output gap, potential GDP,
hyper-inflation, and forecast.
So, the most important long-term question is :
Will the ‘CBOE Potential GDP’ line fall?
or,
Will we have a year of 9% GDP growth someday (2011? 2012? 2013?), just to get us back to the line?
One of the two has to happen.
The last time there was a huge year was 1983 (7.5% GDP growth).
I love it when you publish these comparative economic forecast results whether it’s WSJ or others.
Each new forecast–now for well over a year–shows the bottom in the economy lower and later, and the recovery longer.
Why believe this one?
Eventually they’ll get it right, just like the blind squirrel and the nut.
The stabilization of the economy is probably an effect of the OPEC stimulus, that is the extra purchasing power consumers have as a result of gasoline prices falling from $4 a gallon to $1.5 a gallon. However, now that gasoline prices are stable around $2, the decline in income, home prices, and credit availability will probably be a drag on consumer spending until the effect of the Obama stimulus begins to show up (probably 2009Q3.)
Menzie,
I think it would be fascinating if you can id each of the forecasts and demonstrate that some of the forecasters are able to consistently ‘beat the market’ by correctly forecasting gdp growth, (and specifically the bottom and top of each cycle).
If nobody is consistently accurate, then how do we interpret the results associated with the sampling of a population of random incorrect forecasts?
However, if you can identify a subset who are consistently accurate, then you can use the accurate subset to provide a forecast that has some validity.
tj,
It’s possible that over time no particular forecaster or forecasters have consistently more accurate forecasts, but rather that they are off by offsetting random amounts. If that is the case, then it is perfectly valid to aggregate them.
Are forecasters risk neutral or risk averse?
If risk averse, then these forecasts could be a good indicator of the broader public’s expectations.
Menzie:
“…in 2000-01, when I was following the Japanese economy on the CEA staff… ”
Perhaps you can talk more about what the CEA is supposed to do, what it actually does, and how (in the future) Obama should utilize it.
I would think CEA staff would write policy recommendations and forecast the economic impact of proposed legislation.
Following tj and Brian…
Trimming…reminds me of peeling potatoes that were not perfect, but just tossing them meant that you preferred oatmeal…which you said you would never eat again after breakfast only a few hours ago.
So you start with a baseball-sized potato and you pare it down, hoping those bad spots don’t reappear and that an even number of worm holes means that they were all just “drive thru”s.
Menzie uses (possibly invents?) a new term for me:
Since the trade balance was above consensus, conditional nowcasts of GDP have probably risen. forcing me to consider “pastcasts” like those benchmark revisions from the BLS…making that straight line “Potential GDP CBO Jan 09” such a relief.
The subsequent release of the revised UE numbers (~100k to be added to all months of 2008) may account for the OECD’s gloomier forecasts than the US-based counterparts who are more attached to the official data.
Well, which is it?
Will the ‘CBOE Potential GDP’ line fall permenently?
or,
Will we have a year of 9% GDP growth someday (2011? 2012? 2013?), just to get us back to the line?
It has to be one or the other…
GK: It’s hard to see, but CBO potential does slow down over time, as reduced investment and slower assumed TFP growth kick in (see Figure 2 in this post). My guess is for a slow rebound in growth to close the output gap over several years, given the fact that rebounds from credit-constrained downturns are slow. [1]
Terry: There does seem to be some informational content to averaged forecasts. However, for me, the biggest interest comes from the fact that these forecasts reflect industry views, so one might expect pricing, production and investment decisions to be contingent on these forecasts.
tj: It can be done, but takes a bit of work. See [2], Cho and Hersch (1998 J.Econs&Bus).
GNP: I think forecasters’ aversion is probably better defined as aversion to being wrong when being far away from consensus.
calmo: While I’d like to claim credit for coining the term “nowcasts”, I can’t. It’s been around for a while in the real-time data literature.
MikeR: A good summary of the CEA’s role was provided by Martin Feldstein; see here. Since staff are not policy level, I’d say they analyze policy options. The CEA members decide what policy advice is then forwarded upward.
If we really had potential GDP nine percent higher than actual GDP, we would be seeing broad deflation, instead of narrow asset deflation. Where are car dealers screaming “I have a bargain for you”? Cpi excluding energy is steady on trend.
It looks to me that real and potential GDP has crashed, which is exactly what I would expect from the anti supply measures taken by Bush and Obama.
Make sure you are unemployed, so your mortgage gets forgiven. If you run a business, don’t sell anything, so that your business gets bailed out. In future, your business will be lobbying for tradeable carbon caps, not producing value for consumers. If you create value, you will probably be punished, so if you are too disgusted to lobby for bailouts and carbon caps, go on galt strike – head to some pleasant and remote semi rural area, and work on your fishing.
James A. Donald: If you read the post carefully, you would see that the forecasted (log) output gap for 2009q4 is for -8%. Using the CBO estimate of potential, the output gap is -4.4% in 2008q4 (which is the relevant one assuming current inflation is modeled in the standard Friedman accelerationist framework as depending upon the lagged output gap and expected inflation).
Further, if you read the WSJ forecast carefully, you will see negative inflation forecasted for mid-2009.
And once things start turning around, the Obama tax hikes on income, capital, and small business will kick in, slowing the economy down again. But not to worry, we CAN get to full employment via the Obama route–rather that raise actual output, just reduce potential GDP.
Menzie said: “the biggest interest comes from the fact that these forecasts reflect industry views, so one might expect pricing, production and investment decisions to be contingent on these forecasts.”
I agree, Menzie, and I hope that the fact that not only private sector investment decisions, but national economic policy decisions are being made on these consistently flawed–and consistently underestimating–forecasts is as scary to you as it is to me.
If we apparently can not properly size the economic problem, how can we address it effectively at a national, corporate, or personal level? Moreover, by consistently underestimating the size of the problem, we almost certainly will not put in place policies (& funds) sufficient to resolve the crisis, thereby amplifying and extending its effects.
It all sorta reminds me of the movie, “A Simple Plan.” Bad diagnosis, bad plan, bad results. Unfortunately, the economic effects of the real world version of this range from difficult to dangerous to disastrous.
“But not to worry, we CAN get to full employment via the Obama route–”
A hunter/gatherer society is still full employment.