In today’s NYT, Casey Mulligan presents an interesting picture of GDP during the “1980-82 recession” — the conjoining of the two NBER defined recessions in 1980 and 1981-82. Based on the comparison with the current recession, he concludes:
While the job losses, foreclosures, stock declines and other casualties of the current recession have been very painful, substantially more bad economic news is needed to make this recession worse than the downturns of 1980-’82, at least in G.D.P. terms.
Here is Professor Mulligan’s graph.
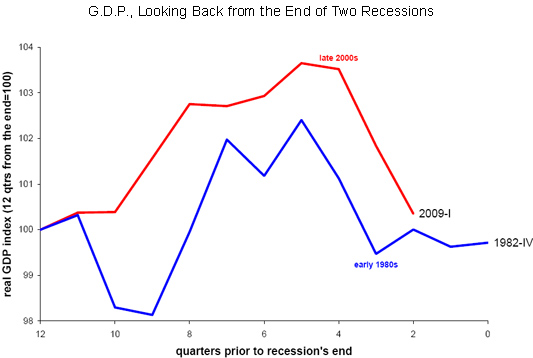
Figure from C. Mulligan, “Worse than 1982?” Economix (June 3, 2009).
Here, without comment, are three graphs of employment and industrial production, but normalizing the start date instead of the end date. Why one would want to normalize on the trough especially when the trough date is unknown, I’m not certain, but there’s nothing to stop one from doing so. But, as I say, I’ll normalize on the start date in the graphs below.
Figure 1: Log real GDP normalized on 2007Q4 (blue), May WSJ mean survey forecast (teal x), log real GDP from “1980-82 recession” normalized on 1980Q1 (red). Source: BEA, preliminary 2009Q1 release, WSJ May survey, NBER and author’s calculations.
Figure 2: Log nonfarm payroll employment normalized on 2007M12(blue), log NFP from “1980-82 recession” normalized on 1980M01 (red). Source: BLS via FREDII, NBER and author’s calculations.
Figure 3: Log industrial production normalized on 2007M12(blue), log industrial production from “1980-82 recession” normalized on 1980M01 (red). Source: Federal Reserve via FREDII, NBER and author’s calculations.
One observation, regarding data revisions. NBER doesn’t place central import to GDP, in part because GDP is subject to sometimes substantial revisions that alter not only the level, but contour of GDP. This is important to the extent that Professor Mulligan’s graph (and my Figure 1) compare preliminary 2009Q1 data to final (and repeatedly revised) GDP figures. I suspect (although have no independent validation) that recent GDP figures will probably be revised downward. In this latest episode, I also wonder about the large contributions to overall GDP growth coming from the finance sector (think about how easy it is to calculate real value added in that sector), when the “F” in FIRE accounts for something like 5% of GDP (see an interesting article by Ed Leamer here).
It is certainly correct that 1980-82 was one big 3-year recession. That most minimal of recoveries in between should not really count.
Many people were out of a job for 3 years straight during that time.
Employment will certainly be worse this time than in 1980-82. Then, the last baby boomers were still entering the workforce. Today, the earliest baby boomers are leaving the workforce.
If not for the vast number of baby boomers entering the workforce for the first time, 1974-82 would have been a depression.
This time, the demographic situation for 2008-20 is unfavorable, but perhaps the rate of technological change + the rate of growth in emerging markets might be enough to stave off depression.
What about the actions of the government during the two periods? They were extremely tight during ’80-’82 and they are almost as loose as they can be now. By definition they could only get more stimulative after the ’80-’82 recession and they can really only get more restrictive now (or not!).
This is really meaningless. Is there anyone who knows about economic conditions during each of these periods who seriously considers them analogous? Of all the periods to compare these are the least analogous:
1980 – Volker raising interest rates; Volker pulling in the money supply; previous 10 years chronic inflation and economic stagflation; new administration seriously cutting taxes; strongest free market administration in 50 years.
2008 – Brenanke pushing interest rates below zero; Bernanke and Treasury coordinated to inject massive liquidity; Presious 10 years low inflation and economic prosperity; Congress and the President raising specific taxes with plans for massive tax increases; most socialist administration (Bush) in our nation’s history with plans to nationalize major US industries.
This may be the best example of the foolishness of aggregate economic analysis that could be presented.
GK, the way I read the chart, employment is already much worse than in ’80-82. You had faster growth going in and a less steep drop off.
You mentioned the baby boom and you also had the increase in women in the workforce. In the past decade, we had a lot of immigration. Lately, labor force growth has slowed. That in itself should take something off of trend GDP growth.
This is a different recession from 80-82. That was an inflation-led recession, this is a classic bank panic (see Gorton, indispensible if you’re interested in what happened).
I would argue that the ’80 recession lasted until 1983, and I could make the case it really lasted until 1986. The key in that recession was the cost of oil consumption, which peaked at 9% of GDP, and it was not until 1986 that the situation returned to normal–the beginning of the Great Moderation, when oil as a share of GDP never rose much above 2%. The period ended when oil touched 4% of GDP in late 2007.
It’s analysis like this that makes it difficult to take many economists seriously. This is right up there with a witch doctor saying that the patterns in the chicken entrails look a lot like they did in the sacrifice he did a few years ago.
Steve Kopits,
You might find it interesting to look at a graph of oil relative to inflation. You will find that oil spikes are during periods of monetary expansion. This might give you pause when considering cause and effect.
Unemployment number is expected to be at 9.2%. I may have backed off of my double digit unemployment by 4th qtr too soon.
That’s a curious reaction, Evil Red Scandi. What parallel do you see, exactly, between (1) looking at the values of GDP, employment, and production during recessions, and (2) looking at chicken entrails? Are you suggesting that only a shaman, and never a real scientist, would be interested in how the behavior of GDP, employment, and production are similar or different across different recessions?
I suggest comparing the GDP GAP at the end of the recessions.
At the bottom in 1982 the GDP GAP was -8.3%.
In first quarter of 2009 it was -6.6%.
The CBO estimates that potential real GDP growth was 3% in 1982 and is 2.5% now.
Moreover, at the 1982 bottom, manufacturing capacity utilization was 68.6%. Currently it is 65.7%, suggesting that the current recession is already generating more excess manufacturing capacity than the 1981-82 recession did.
I suspect that by the time this recession is over the unused economic capacity will be very similar to that at the 1982 bottom.
PS> if 3rd Q real gdp falls at a 4% annual rate the GDP GAP would be -8.4%, essentially the same as -8.3% reading at the bottom in 1982.
“Why one would want to normalize on the trough especially when the trough date is unknown, I’m not certain”
If that is a question, the answer is: if one’s name is Casey Mulligan, one has no shame of looking stupid. So the wheels are off, if you are Casey Mulligan, you can normalize recessions based on the date of the coming visit of little green men.
Is the Chicago School still open? I thought they had closed it down after ol’ Milty left for teaching Voodoo instead of science!
Anyone who doesn’t think that this “recession” isn’t something far worse than anything since the great depression has not been paying attention.
Private debt is currently at around 100% of GDP, the highest since… yes, you guessed it!… 1929.
Real median family incomes have been dropping since 1980, and precipitously since 2001.
Family asset value is also at its lowest since 1930.
This means that this recession will NOT be consumer led.
You could tell that something was very wrong structually with this economy during the years from 2001-2008 when GDP was rising, productivity rose 25%, yet real median family income dropped 7% and savings rates went to effectively zero.
A capitalist system cannot thrive without a thriving middle class, because it depends 70% on consumer demand.
So, if you bankrupt the middle class, you will effectively choke off demand, and the whole system will come crashing down.
We are in for a long period of restructuring of our whole economy. Financial services will have to shrink from its current parasitic level of 22% and healthcare costs also will have to shrink from their equally parasitic level of 18% of GDP.
That means that bankers will have to get back to the less glamourous profession of actually banking, and the healthcare industry will have to shed the fat of its parasitic class of insurance companies.
In the meantime, there will be no really significant uptick in consumer demand for a long time, so the recovery will have to be led by government investment in infrastructure projects, etc.
And perhaps Casey Mulligan can find another job looking for leprechauns. I don’t think economics suits him at all.
I’m not convinced that the past two recessions are fair comparisions for our present situation since i) this is systemic in nature as opposed to previous two recessions ii) it is financial in nature as opposed to manf. driven recession iii) household balance sheets are in a state of disarray that exceeds the previous 5 recessions.
Dick F has it exactly right. In 1980, we were taking our medicine in order to get to economic health. In 2009, we are printing money to put off the day of reckoning, to obscure the insolvency all around us, to deny the truth.
Unemployment was 9.4%. Apparently I was right after all, double digits by the 4th QTR.
Lots of great points, and posts especially Economists, GK, and MikeR, But, and there is always that “but,” We did not have the potential of the ROW Chindia,and the rest of the emerging countries to help restore demand back in the early 80’s. I am in the camp that myself and my investment partner call “SGM” (Slow Growth Mode) but still think the ROW could limit the downside, and has done that to some degree, and growth could trend higher than what most expect.
“I would argue that the ’80 recession lasted until 1983, and I could make the case it really lasted until 1986”
I would even go as far as say mid-1996 was the true recovery from that depression that was the early 80’s. Terrible recession. High rates of crime and poverty to the mid-90’s when it plunged, no surprise.
” Why one would want to normalize on the trough especially when the trough date is unknown, I’m not certain, but there’s nothing to stop one from doing so.” – Menzie
Casey Mulligan is writing for New York Times readers. If they are like many other Americans, including and especially those on the ‘street’, they are eagerly anticipating an end to this recession very soon. Right or wrong.
This is a fascinating example of how indexing time series can give such different results by simply choosing different common starting dates. Just imagine what a clever virtuoso can do with Bayesian econometric models and lagged endogenous-variable time series models! (Sorry, couldn’t resist.)