By Hiro Ito
Today, we’re fortunate to have Hiro Ito, Associate Professor of Economics at Portland State University as a guest blogger.
In my last posting, I introduced a recent paper coauthored with Menzie Chinn and Joshua Aizenman (UC, Santa Cruz) on the “trilemma,” or “impossible trinity” — a country simultaneously may choose any two, but not all, of the three goals, monetary independence, exchange rate stability and financial integration.
In that paper, we introduced the indexes that measure each aspect of the three trilemma configurations for more than 170 countries in the period 1970 to 2006. Using these indexes, we have shown that major crises and economic events in the last four decades caused structural breaks in the trilemma configurations.
We also tested the linearity of the indexes and confirmed that countries do face the trade-off of the three policy choices. In short, we empirically found the impossible trinity is “binding.”
Regression Analyses
In the previous paper, we did not attempt to answer the question of what kind of policy goals policy makers would like to achieve by choosing a certain policy combination based on the trilemma. This is the main motivation of our second paper. More specifically, we test how the three policy choices individually or interactively could affect the macroeconomic outcomes such as output volatility, inflation volatility, and medium-term inflation rates in developing countries, especially, emerging market countries.
Upon investigating the link between the trilemma configurations and macroeconomic performance, we pay close attention to three other factors, namely, international reserves (IR) holding, financial development, and external finance.
Below, let me briefly explain the estimation method we take in this paper and present the main regression results while incorporating the above three factors.
The Basic Regression Model
The basic model we estimate is given by:
![]()
yit is either output volatility (measured as the five-year standard deviations of the per capita real output growth rate); inflation volatility (as the five-year standard deviations); or the level of inflation (as five-year averages), for country i in year t. TLMit is a vector of any two of the three trilemma indexes, namely, Monetary Independence (MI), Exchange Rate Stability (ERS), and Financial Integration (KAOPEN). TRit is the level of IR (excluding gold) as a ratio to GDP, and (TLMit x TRit) is an interaction term between the trilemma indexes and the level of IR to see whether IR holdings complement or substitute for trilemma policy choices.
Xit is a vector of macroeconomic control variables based on the literature, such as relative income (to the U.S.); trade openness (=(EX+IM)/GDP); the TOT shock; fiscal procyclicality (as the correlations between HP-detrended government spending series and HP-detrended real GDP series); M2 growth volatility (as five-year standard deviations of M2 growth); private credit creation as a ratio to GDP as a measure of financial development; the inflation rate; and inflation volatility. Zt is a vector of global shocks that includes change in U.S. real interest rate; world output gap; and relative oil price shocks. Di is a set of characteristic dummies that includes a dummy for oil exporting countries and regional dummies. The data set is organized into five-year panels of 1972-1976, 1977-81, 1982-1986, 1987-91, 1992-96, 1997-2001, 2002-06. All time-varying variables are included as five-year averages.
Below are some key findings from the regression exercises.
Finding 1: Impact of the trilemma configurations on output volatility
1. Greater monetary independence can dampen output volatility
2. Greater exchange rate stability implies greater output volatility for emerging market countries. However, its volatility increasing effect can be mitigated by holding IR greater than 19-22% of GDP.
Let me elaborate a little more on this finding. The figure below graphically shows the marginal interactive effects between ERS and IR based on the regression estimates for the emerging market economies (EMG). For presentation purposes, in the figure, the EMG group of countries is divided into (a) the Asian group, (b) the Latin American group, and (c) the other EMG countries. In all the panels of figures, the contours represent different levels of the effect of ERS on output volatility conditional on the level of IR. Also, the solid horizontal line refers to the threshold of IR at 21% of GDP, above which higher levels of ERS will have a negative impact on output volatility.
In the figure, we can see that the further toward the northeast corner in the panel (i.e., higher ERS and IR), the more negative impact it can have on output volatility. Below the threshold, however, the further toward the southeast corner (i.e., higher ERS and lower IR), the more positive impact it can have on output volatility. In each panel, the scatter diagrams of ERS and IR are superimposed for the sample countries with the black circles indicating ERS and IR for the period of 2002-06 and the red “x’s” for 1992-96.
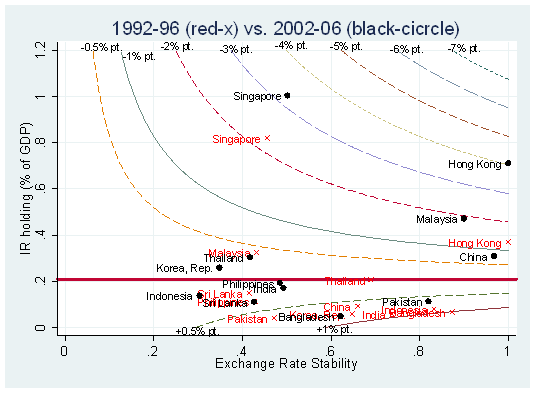
Figure 1a: Non-linear Effect of Exchange Rate Stability, Asian EMG
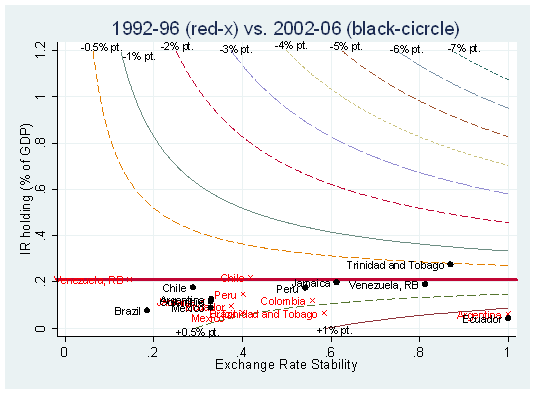
Figure 1b: Non-linear Effect of Exchange Rate Stability, Latin American EMG
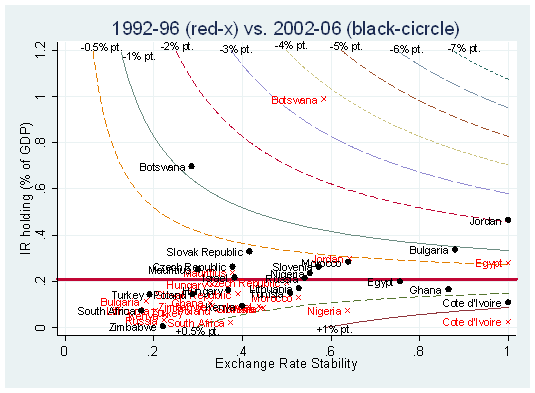
Figure 1c: Non-linear Effect of Exchange Rate Stability, EMG excluding Asia and Latin America
From these diagrams, we can make several interesting observations.
1) Between 1992-96 and 2002-06, a period which encompasses the last wave of global crises, many countries, especially those in East Asia and Eastern Europe, increased their IR holding above the threshold.
2) The movement is not necessarily toward the northeast direction. Rather, it is around the threshold level where the effect of ERS is neutral (i.e., zero percentage point impact), unless they move much higher toward output volatility-reducing territory (such as China and Bulgaria).
3) While we observe a moderately positive association between ERS and IR, none of these observations are applicable to Latin American countries.
4) Only a handful of countries such as Botswana, China, Hong Kong, Malaysia, Jordan, and Singapore have achieved ERS-IR combinations to reduce output volatility significantly.
Given these observations, at the very least, we can see the point of why many countries, especially those with the intention of pursuing greater exchange rate stability, are motivated to hold a massive amount of international reserves.
Finding 2: Interactions Between the Trilemma Choices and Financial Development
In the previous regression exercise, we also found that more financial development can lead to less output volatility. One may also wonder how trilemma configurations can interact with financial development. Theoretically, more independent monetary policy should work better with more developed financial markets to reduce output volatility. The volatility-increase effect of exchange rate stability may be less disturbing if financial markets handle capital allocation more efficiently. Financial liberalization should work hand in hand with financial development to reduce economic volatility.
To see the interactive effect of financial development with the trilemma configurations, we use the dummies for different level groups of private credit creation as a ratio to GDP (PCGDP) — PCGDP_HI for the 75th percentile level of financial development, PCGDP_LO for the 25th percentile PCGDP, and PCGDP_MD for in-between. We also interact these level category dummies with the trilemma indexes and include the interaction terms in the above output volatility regressions, hoping to capture the effect of financial development on the link between the trilemma choices and output volatility.
We find the following for the group of emerging market countries:
1. Countries with medium levels of financial development tend to experience higher output volatility when they pursue a more stable exchange rate, suggesting that countries with newly developed financial markets can be volatile when they pursue greater exchange rate stability.
2. Those EMGs with medium or higher levels of financial development tend to experience less output volatility if they pursue more stable exchange rates. Those with underdeveloped financial markets on the other hand tend to experience greater output volatility if they pursue greater financial openness. These findings suggest that having a higher level of financial openness and financial development can yield a synergistic impact to dampen output volatility, but that a country with underdeveloped financial markets can exacerbate output volatility caused by financial liberalization.
Finding 3: Interactions Between the Trilemma Choices and External Financing
To incorporate the impact of external financing, we also include in the basic regression models the variables for net inflows for FDI, portfolio investment, and bank lending, both individually and interactively with the trilemma policy configurations.
In these estimations, we find the following.
1. Net recipients of cross-border bank lending or portfolio flows tend to experience higher output volatility.
2. Net FDI inflows tend to dampen output volatility, but it can increase the volatility in a regime with greater monetary independence and more stable exchange rates.
3. Net portfolio inflows can be volatility-increasing, and its effect is greater for the countries with currency union or alike regimes. This type of regimes, however, can dampen the volatility-enhancing effect of bank lending.
4. The greater the debt service is, the more likely a country could experience greater output volatility, especially when combined with greater exchange rate stability and financial openness, a result consistent with the “original sin” literature.
Implications for the Current Crisis
Does IR holding “relax” the trilemma?
Using these estimation results, we take a closer look at the motivation of developing countries to hold massive IR from a different angle and examine one possible conjecture that countries hold massive IR to relax the trilemma, i.e., simultaneously achieve all three goals.
Figure 2 displays a scatter diagram for EMG countries’ ERS and MI_KAO, a composite index of MI and KAOPEN as a proxy to the weighted average of MI and KAO. The theory of the trilemma predicts that these two variables should be negatively correlated – the higher level of ERS a country pursues, the lower level of the weighted average of MI and KAO it has to choose as we formally confirmed in the previous paper.
In the figure, there are two groups of country-years shown; one is a group of country-years with the IR holding greater than 21% of GDP, the threshold above which greater ERS can be volatility-reducing as shown in Figures 1, and the other is those with the IR holding less than 21% of GDP.
If IR holding can relax the trilemma, the (green) triangles — country-years with >21% IR — in the diagram should be scattered above the circles — country-years with <21% IR.
When we run a simple linear regression of MI-KAO on ERS for the two subsamples, we find that the fitted lines for both groups are barely and insignificantly negatively sloped. Simple coefficient equality tests reveal that the slopes of the two fitted lines are not statistically different from each other, but that the intercept for the fitted line for the country-years with >21% IR is significantly higher than that for the <21% IR group. This is consistent with the conjecture that higher levels of IR holding can allow a country to pursue a higher weighted average of MI and KAOPEN, i.e., relax the trilemma.
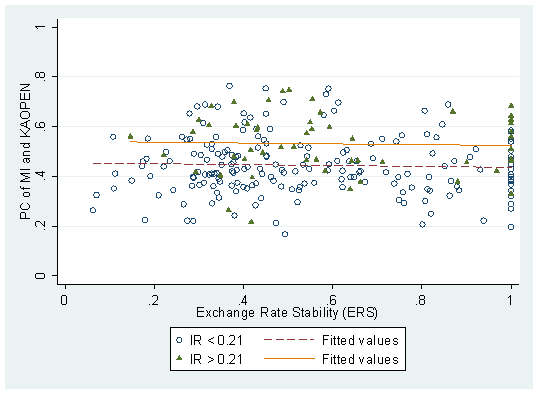
Figure 2: Do IR holdings “relax” the trilemma?
One easy “suspect” for a country that holds IR as an attempt to relax the trilemma is China. Figure 3 shows the trilemma configurations and IR holding for emerging market countries in East Asia and China. We can observe that while it does not give up its exchange rate stability and monetary independence, China’s IR holding has been increasing and financial openness has inched up. Although we have not tested formally, we find evidence consistent with the view that countries’ efforts to “relax the trilemma” can involve an increase in IR holding, which may have contributed to the global expansion of liquidity prior to the financial crisis of 2008-09. We leave testing this argument as one of our future research agendas.
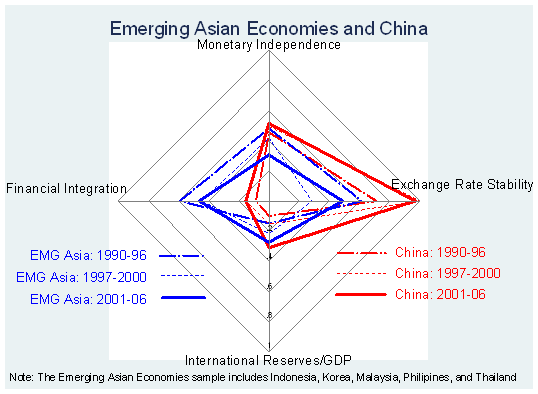
Figure 3: Trilemma Indexes and IR Holding for Asian EMG and China
Lastly, we find that our empirical findings are consistent with the conditions of the countries that are currently experiencing macroeconomic turmoil; countries in turmoil do seem to be the ones with the trilemma variables and those related to both internal and external financing at the levels that lead to higher output volatility. In other words, our model could predict higher output volatility for countries experiencing or at the brink of financial crises. This bolsters the validity of our empirical analyses.