There’s plenty of commentary on the ongoing China-US Strategic and Economic Dialog, from the Economist [1], Reuters [2], [3], and Bloomberg [4] [5]. Here are three pictures to place some of the issues in perspective.
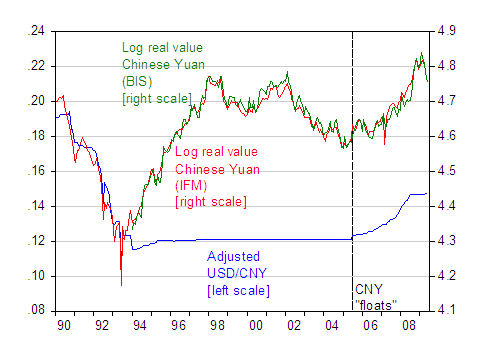
My first observation is while the nominal USD/CNY had stabilized in recent months, the exchange rate that matters most for global imbalances, the Chinese real trade weighted CNY, has moved around a bit, as the dollar has appreciated and depreciated.

Figure 1: Bilateral nominal USD/CNY exchange rate, period average (blue, left scale), log IMF trade weighted real effective CNY (red, right scale), and log BIS trade weighted real effective CNY (green, right scale). Bilateral exchange rate adjusted for swap center rates used before 1994; see Fernald, Edison, Loungani (JIMF, 1999) for details. Source: St. Louis Fed FREDII, IMF, BIS, and author’s calculations.
I must confess that while I’ve thought the yuan should have been allowed to appreciate more rapidly in the past [6], I’ve never believed that that in itself would substantially shrink the US-China trade deficit, in particular because of the relatively small estimated trade elasticities (see this post)
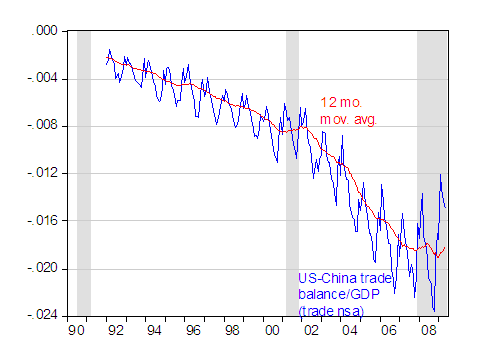
Second, the US-China bilateral trade balance, as measured by US trade statistics, has — like the non-oil US trade balance overall, stabilized as well, and seems like it may be increasing (i.e., the deficit shrinking) in the short term.

Figure 2: US-China trade balance, nsa (blue) and twelve month trailing moving average (red), divided by Macroeconomic Advisers estimate of monthly GDP. NBER defined recession dates shaded gray. Source: BEA/Census via St. Louis Fed FREDII, Macroeconomic Advisers, NBER, and author’s calculations.
Notice that since the trade balance is normalized by nominal GDP, there’s a “race” going on; the 12 month trailing moving average of the bilateral deficit in the numerator is shrinking, but so too is the nominal GDP in the denominator.
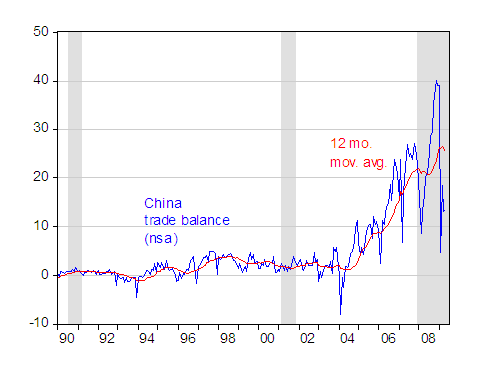
While the US-China trade balance is of interest primarily for political reasons, it’s the Chinese overall trade surplus which is key for thinking about global imbalances.

Figure 3: Chinese trade balance, in millions USD per month, nsa (blue), and twelve month trailing average (red). NBER defined recession dates shaded gray. Source: Chinese trade statistics from IMF, IFS, ADB; and NBER, and author’s calculations.
Here too, it’s early in the story to be able to say where the trade balance will go. In the April 2009 IMF World Economic Outlook, the Chinese CA surplus was forecasted for 10.3 ppts of GDP in 2009, and 9.3 in 2010. The most recent Public Information Notice for China (released 5 days ago) forecasts 9.5 for 2009, so clearly events are fast overtaking forecasts.
Here, of course, I’m talking about short term trends, and these are dominated by the financial crisis and recession [7]. My friend Eswar Prasad writes on prospects and policy implications for China while Bertaut, Kamin and Thomas write about what happens after the recession to the US external accounts, based upon pre-crisis trade elasticites. Whether those estimated trade elasticities will be the right ones in the longer term is up for debate (see here).
In any case, I think it is a good sign that in the debate, we see a greater focus on relative saving in the US and China (Bloomberg, Reuters), as a variable that has to be affected over the longer term, in order address global imbalances on a sustained basis.
By the way, Brad Setser has beat me to the punch (again), so be sure to read his post Update 2:45pm: although Brad Setser points out that we differ on the relative importance of the exchange rate.
Update 7/28 11:51am Pacific: IIE has released a new book by Morris Goldstein and Nick Lardy, entitled The Future of China’s Exchange Rate Policy. I haven’t received the hard copy, but there are several preview chapters available. They argue — from a back-of-the-envelope calculation — that a 45% appreciation would have eliminated the 2007 trade surplus of 11 percentage points of GDP.
Technorati Tags: Strategic and Economic Dialog, yuan,
renminbi, China.
not sure i really beat you to the punch, as we have slightly different points of emphasis.
I have to confess that I wasn’t persuaded by the data on low elasticities for that the RMB/ $ on US-China trade, largely because it has struck me that if the RMB/ $ is stable for most of the sample period and there is volatility in trade, the math with end up working in such a way that other variables “explain” changes in the rate of growth. A fair amount of work has found that China’s RER impacts China’s overall export growth (just as the US RER impacts US export growth), so my baseline would be that the elasticities for overall exports and imports are probably a better guide to the impact of a floating RMB on US-China trade than the elasticities from the days of the peg. Certainly US imports from china slowed when the rmb started to appreciate v the usd for real in late 07/ early 08 — but the US economy also was slowing at the time so sorting out cause and effect will be hard.
I would be most interested though in your rebuttal to my view on elasticities though; i am amenable to persuasion.
as for china’s overall current account surplus, my guess is that the imf has been influenced by the q2 data (especially june), which shows a lower surplus in q2 09 than in q2 08 despite the fall in oil prices. that’s a big change from q4 08, when the fall in oil prices overwhelmed the impact of falling exports (in part b/c china’s imports really fell, and not just its oil imports). if sustained, this does suggest some fall in china’s surplus over 09 as a whole — even though the trailing 12m sum picked up in q4 08 and q1 09.
bsetser: Thanks for the insights. I’m relying upon the econometric results obtained in Cheung et al., reported in this post. Our estimates indicate a roughly 46 billion (2000$) decrease in the Chinese trade balance for a 10% appreciation; this compares to something close to a 89 billion decrease according to the Marquez-Schindler estimates. The annualized 12 month moving average value from Figure 2 is about 300 billion USD (nominal), so a yuan appreciation is not inconsequential. But one needs a big appreciation to halve that surplus, holding all else constant.
On the other hand, estimated income and supply elasticities are pretty large, so other factors like income (or consumption) and capital investment can have substantial impacts. That is where I think one might see bigger adjustments (after all, the US adjustment in its trade balances is to a large extent driven by changes in trend income and consumption).
That being said, I agree that we do not have a good handle on the trade elasticities, as we tried to stress in our paper.
Menzie — I am guilty of not following your links and instead working off memory; I was thinking of the mann and pluck paper (big income elasticities for sino-us trade, no price elasticities) not your paper, which has different results for sino-US trade. my bad!
what do you think drives the fall in imports in response to a real appreciation in your paper, especially the size of this effect? i can see how price and volume effects offset on imports, so imports respond more weakly to RER changes than exports in $ terms. but I have a bit of trouble understanding how an RER appreciation leads to a bigger fall in real imports than real exports (which as you all note cannot be explained by processing)
also, how well do various models do at forecasting the rise in China’s surplus from 04 to 07 based on the available data? my gut here is that income elasticities + differences in growth can not have been large enough to expansion, as China’s growth was fairly strong over this period (and it was fairly strong even if you strip out the impact of net exports). certainly the price elasticities seem to small to explain how a 10-15% real depreciation would drive the observed expansion. Basically if you put the 02-04 real depreciation into the model and add in the observed growth rates, what is the forecast Chinese trade surplus or deficit?
bsetser: Good questions; I don’t have a good explanation for why there’s such a perverse price elasticity estimate for ordinary imports. I think others have speculated that it has to do with state owned enterprises; I suspect it has to do with co-trending of consumption and the real exchange rate, but that’s just conjecture. On the other hand, we do obtain correctly signed (but insignificant) price elasticities for US imports into China, so perhaps this has to do with compositional changes. A recent BIS working paper by Garcia-Herrero and Koivu concludes:
Regarding econometric fit of models for the Chinese trade surplus, well, I don’t have any information, above and beyond that in the BIS working paper cited above. For us to update the analysis, we’d need to get (among other things) updated capital stock estimates for China, and rest-of-world GDP, as well as reconsruct the competing exporter real exchange rate index. So, unfortunately, I don’t have an answer for you.
In any case, I think it is a good sign that in the debate, we see a greater focus on relative saving in the US and China (Bloomberg, Reuters), as a variable that has to be affected over the longer term, in order address global imbalances on a sustained basis.
Menzie, shouldn’t we be looking at total saving, including US government debt? And if we do that, aren’t we still as a country dis-saving? So if there is an improvement in the balance of trade right now, it isn’t coming from an increase in overall US saving, right?
Moreover, wasn’t there a time in the ’90s that, with the budget SURPLUS (boy, doesn’t that seem a long time ago?), we had net positive savings? I don’t recall the trade deficit improving much in that time frame. Of course, there could have been mitigating factors like the Asian financial crisis, collapse of commodity prices, Internet bubble, etc. etc. etc.
Buzzcut: Reasonable analysts would allow that there are multiple shocks that drive the system; even in a simple Mundell-Fleming demand-side model, the correlation between the budget surplus and the current account depends upon the nature of the shock. Add in supply shocks, and this is even more true.
Right now, in the short term, the current account is improving because in part household saving is rising, even as government saving is falling (by the way, I think you want to look at the budget deficit, not the debt which is a stock, while CA is a flow), and collapsing private investment in physical capital. I think most forecasters are predicting a long term rise in the household NIPA-based saving rate.
Right now, in the short term, the current account is improving because in part household saving is rising, even as government saving is falling (by the way, I think you want to look at the budget deficit, not the debt which is a stock, while CA is a flow),
Sorry, I was imprecise in my wording. Of course, we’re talking about the deficit.
Can you post the numbers for household savings vs. the deficit? I find it hard to believe that households are saving MORE than we’re deficit spending. A trillion dollars is about $3000 for every man, woman, and child in this country. You’re telling me that people are increasing their savings that much, offsetting the deficit spending, and then some? Doesn’t seem plausable.
I understand the comment about the multiple shocks, but it just seems like a very convenient argument. If that’s the case, how do you determine causalities?
BTW, this is a good post. You always have excellent graphs, and your hyperlinking to your sources is excellent, as always. Even though I never agree with you, I appreciate the work you put into these posts.
This is the topic I’m most interested in, the interaction between currencies, deficits, and the current account. And how the Asian governments may or may not be manipulating their currencies.
Buzzcut: Thanks for the compliments. Even if you look at just two variables, that’s still a model; there’s no escape from making assumptions in talking about how the world works.
From 08Q1 to 09Q1, household saving rose about $443 billion, net private saving about $334 billion; net government saving fell about $531 billion. But gross domestic investment fell about $431 billion, so the current account improved over that period.