My article with Jeffry Frieden and the decomposition of the 2001-07 change in the deficit discussed in The Lasting Legacy of the Bush Tax Cuts inspired lots of vigorous debate regarding the role of the Bush deficits in the current crisis. Here is the CBO‘s take on the cyclically adjusted budget balance:
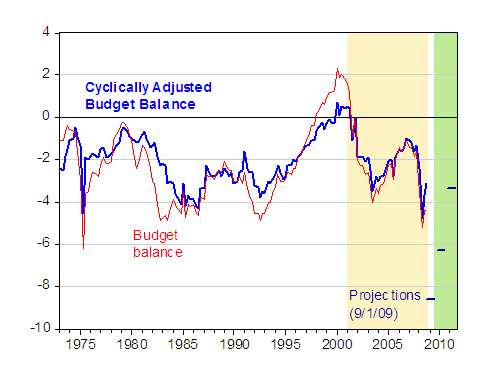
Figure 1: Cyclically adjusted budget balance (blue) and budget balance (red), in percent of GDP. Projections of cyclically adjusted budget balance (dark blue, by fiscal year). Tan shading indicates G.W. Bush years. Light green shading indicates projections. Source: CBO, Measuring the Effects of the
Business Cycle on the Federal Budget: An Update, September 1, 2009.
The cyclically adjusted budget balance, sometimes known as the full employment budget balance, is the budget balance that would obtain when GDP is at potential. In principle, the cyclically adjusted measure better measures the stance of fiscal policy, as it removes the endogenous components of spending and revenues.
The G.W. Bush budget balance averaged -2.23 ppts of GDP; the cyclically adjusted budget balance was -1.97 ppts. Keeping in mind the tax cuts of 2001 and 2003 — the FY2000 cyclically adjusted revenues-to-GDP ratio was 20.1 ppts; the FY2002 was 17.8 ppts. The FY2004 revenues ratio was 16.5 ppts.
sigh
I remember studying the in Econ in the late ’60’s, a variation of the “We are all Keynesian” propaganda. The trouble is nobody would pull the trigger and target a government surplus in the intervening years–Nixon, Ford, Carter, Reagan, Bush I, Clinton (accidentally got a small surplus for a couple years), Bush II, Obama. The long-term balanced budget is a way, without a will. Nice topic in Econ 101; no topic in DC. And now with Obama, we get double dip deficits, trend deficits from gov’t spending going forward plus heaping of new programs, regulations and production controls onto the economy multiply the deficits several fold.
Civil disobedience by The Professariate:
http://www.sacbee.com/ourregion/story/2157486.html
Will Profs. Chinn and Hamilton ‘down tools’/’down PowerPoints’ at Madison and UCSD, in solidarity with their UC Davis brethren?
? The short blue bars are projected adjusted balances, I presume, but where are the unadjusted projected balances?
The projections appear to presume a resumption of low private savings, which I doubt.
Revenue fell in 2008 and will fall in 2009. Since 1962 there have been 11 years (out of 47) where revenues have increased double digits.
How many of you believe that tax revenues will increase by double digits in 2010 and 2011?
The CBO is projecting 11.9% increase in revenue in 2010 and 18.0% in 2011. Hmmmmm!
Never in the 47 years have outlays gone down. The CBO is projecting a -1.14% decrease in outlays in 2010 and only a .07% increase in outlays in 2011. Hmmmm, again!
And now with Obama, we get double dip deficits, trend deficits from gov’t spending going forward plus heaping of new programs, regulations and production controls onto the economy multiply the deficits several fold.
Uh, ok. Talk about mumbling. How can we have “regulation” when the plutocracy has captured the regulatory environment?
2010 is when Bush tax cuts sunset, isn’t it? 2010 also has a special IRA convertibility law for which people would pay the tax in 2011 and 2012 (convertibility into Roth even for people who wouldn’t normally qualify because they make too much). Given both of those changes, it’s definitely plausible for revenues to be up quite a bit.
@Menzie,
I was reviewing the cyclically adjusted budget deficit data lately so this post was amazingly synchronistic.
@DickF,
Evidently corntrollio has already addressed some of the revenue side. I’ll just add that the economy is forecast to grow quickly from 2011 on foreward.
On the spending side a lot of the economic emergency spending will be winding down in 2010 and 2011. TARP is essentially an FY 2009 program and ARRA will start to wind down quickly in FY 2011.
So it’s not too surprising.
….and the standard errors around those estimates would be how big?
Gene: “Clinton (accidentally got a small surplus for a couple years),”
I love how right-wingers look at everything good happening under Clinton as being an accident. Of course, when one’s policies can be summed up as f*cking everything up, perhaps they don’t understand doing a good job
A question (stemming from my ignorance of macro):
Why is there a business cycle in “cyclically adjusted budget balances”? What policy changes were put into place from 2003-2007 that led budget balances to improve?
Basically, I confess I am ignorant as how to read this graph.
Roger
Dick F,
High rates of growth in revenue are likely given that the plunges in corporate tax receipts as well as capital gains will be somewhat, though not totally, undone. They also make the assumption that the Bush tax cuts will be reversed as current law provides, which will be somewhat true.
Additionally, the reason they have total expenditures falling is due to the fact that TARP will not recur as well as the fact that the stimulus funding will be falling by FY2011.
Throughout all eight years, the deficit was decreasing (or the surplus was growing).
Get over it; Clinton was more fiscally responsible.
It seems to me indisputable that Bush was fiscally irresponsible and his large deficits contributed to the current crisis. By the same token, the enormous growth of the deficit during Bush’s last months and Obama’s first months are sewing the seeds of bigger financial trouble down the road.
However, that does not say anything about whether Bush was right to make income tax less progressive. It’s possible to support him on that point while still criticizing his overspending.
Weird graph. Can somebody explain it a little more than Menzie did?
For example, why does the graph start to move towards balance in ’03, just after the second round of Bush’s tax cuts? Seems to counter Menzie’s argument.
Buzzcut: The deficit is the difference between spending and revenues. All I mentioned are revenues. Revenue impacts can be seen in this CBO document, Table 1-8. The biggest impacts are in FY (not CY) 2004.
Menzie, I’m just looking at the graph, okay?
Bear with me…
Figure 1, “Cyclically adjusted budget balance” in blue, “Budget balance” in red. Year on the x axis, % of GDP on the Y.
So, starting in ’03, the budget deficit was increasing, but at a slowing rate (the “deceleration”, slope of the line, looks to be the same as during the Clinton years, maybe a little steeper, in fact). Given enough time, it would have gone positive (from deficit to surplus), just like the Clinton years.
Looking back to the Clinton years, I see that the deceleration trend starts in… ’92! It predates Clinton. ’93 tax increase seems to have had no effect one way or the other.
I don’t know, Menzie. The story that this seems to be telling is one of growing out of deficits, not one of increased or decreased tax rates having ANY influence on the cyclically adjusted budget balance.
What am I misreading?
Nice graph, BTW. Good find. Thanks for posting it.
Buzzcut: What I was getting at was the fact that the 2003 tax cut had a big downward effect in FY 2004 particularly, and was smaller in FY2005. Spending, on the other hand, was plugging upwards at a more or less steady trend (see CBO document, Table 2, cited in the blogpost).
Menzie, if that is so, then why was the cyclically adjusted budget balance improving at the same rate in ’04 as in ’03?
If revenues fell greatly in ’04, and spending increased at the same rate, would not the CABB trend in a different direction (slope of the line change)?
That’s not what I’m seeing. Admittedly, the scale of the graph makes it difficult to see where the upward trend begins.
In any case, the CABB starts upward sometime around ’03/’04, and increases at a rate that is similar to, if not a little faster than, the late 1990s. Given enough time, we would have been in surplus at some point. Looks like ’09 or so.
BTW, the slope on those projections appears to exceed even the ’04-’07 time frame. That would be a good thing, no?
A large economy has more money than does a small economy. Therefore a growing economy requires a growing supply of money, aka deficit spending.
Concern about the federal debt revolves around two beliefs: Someone (often characterized as ?our grandchildren?) will have to pay those debts, and large debts cause inflation. For us citizens, personal debt is concerning, because debt must be repaid. People go bankrupt when they can?t repay their debts. But, if you owned a magic printing press, and you had the legal right to print as much money as you wished, debt never would concern you.
Received a bill for a million dollars? No problem. Turn on the magic press and poof!, it?s paid. Unfortunately, you and I don?t own a magic press, so we worry about our debt.
The federal government, uniquely among all U.S. debtors does own that printing press. It can pay bills of any size, which is how today, it easily services a gross debt of $12 trillion. Not even during the current recession has any federal check bounced. Not even close.
Still we worry about federal debt as though it were our own. Why? Partly because so many people tell us we owe the federal debt. How silly. Debt is owed by borrowers. We are not the borrowers. In many cases, we are the lenders, the owners of T-securities. The government is the borrower, and we are not the government. There will be no bill collectors on our doorsteps, demanding that we pay our mythical share of the federal debt.
But won?t ?our grandchildren? have to pay for the debt through higher taxes? For the past 50 years, tax rates actually have gone down, despite massive deficits. There is no relationship between deficits and tax rates, which are political, not financial, decisions.
What if tax rates don’t rise, or rise moderately? Let’s do the math. Say in Year One, taxes total $10 trillion and spending totals $11 trillion. Spending exceeds taxes, which causes a $1 trillion debt.
In Year Two, tax rates rise, so taxes now total $11 trillion, but spending rises to $12 trillion, and now the debt has risen to $2 trillion.
How much of Year One’s debt did taxpayers pay? None. Taxes weren?t even sufficient to pay for Year two’s spending, let alone pay for last year?s debt. The only time taxpayers pay for debt is when taxes exceed spending, i.e a surplus.
This is why surpluses have caused all six depressions in U.S. history. Surpluses, not debt, cost taxpayers money.
The inflation logic is that federal debt increases the money supply (true), which dilutes the value of money (not true). Money value is based not only on supply, but also on demand.
Money supply can increase massively, and still not cause inflation, if demand goes up as much. Demand is determined by risk and reward. Risk is inflation (which is a result, not a cause), so the key to money value is reward.
What is the reward for owning money? One reward is the ability to buy things with it, but in a massive economy like ours, there always are plenty of things to buy. The real reward for owning money is interest. The higher the rates, the more valuable the money. That?s why the Fed raises rates at even the hint of inflation, and that also is why in the past 50 years, there has been no relationship between federal deficits and inflation. None.
In conclusion, rather than being concerned about federal debt, we should be concerned about economic growth, which relies on money growth, i.e deficits.
Rodger Malcolm Mitchell