Last April I described new research on the role of oil prices in the recent recession. Here’s an update on what’s happened since then.
In a paper presented at the
Brookings Institution last spring, I examined the post-sample forecasting performance of an equation originally published in 2003, which relates real GDP to past values of GDP and oil prices. I noted in April that if you had known in October 2007 the values of GDP through 2007:Q3 and what was about to happen to oil prices through 2008:Q2, you could have used that historical relation to predict the value of U.S. real GDP for 2008:Q3 with an accuracy better than 99.5%.
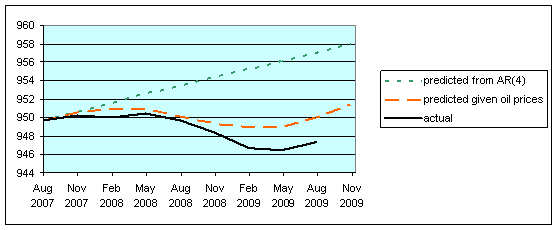 |
In the figure above I extend the earlier-reported forecast an additional four quarters and compare the projection with what actually happened to GDP through 2009:Q3. The dotted green line is a forecast formed in October 2007 of what would happen to U.S. GDP if you used nothing more than the values of GDP observed through 2007:Q3. Basically that forecast simply extrapolates the recent prior trend. The dashed red line is the forecast that uses GDP values only through 2007:Q3 but also uses knowledge of what was going to happen to oil prices between 2007:Q4 and 2009:Q3. If you treated oil prices as the only thing that matters for the economy, you would have predicted the bottom would be reached in 2009:Q1, flat growth between 2009:Q1 and 2009:Q2, and normal growth resuming in 2009:Q3. That’s exactly the trajectory that GDP has taken so far, although the bottom in 2009:Q2 was 2-1/2 percent lower than would be predicted on the basis of oil prices alone.
I have no doubt that the problems with financial markets were a bigger factor than oil prices in the striking collapse in output in 2008:Q4 and 2009:Q1. The other approaches to measuring the contribution of oil to the downturn surveyed in my Brookings paper would estimate a smaller contribution of oil to the downturn than suggested by the figure above. On the other hand, all of the approaches surveyed in that paper suggest that oil made a material contribution to the initial downturn, and it seems hard to deny that that the severity of the financial crisis was exacerbated by the fact that the U.S. had spent three quarters in recession prior to the failure of Lehman in September 2008.
What do these estimates imply looking forward, with oil prices now back up to $80 a barrel? The relation used to produce the figure above assumes that there is a threshold effect before the next oil price shock would begin to do its damage. According to that relation, oil has to get back above $130 before it would matter again for GDP growth. On the other hand, the original research on which that relation is based acknowledged that there’s really not a very compelling basis in the data for choosing among various plausible nonlinear possibilities. The other approaches surveyed in my Brookings study assume a simple linear relation, according to which the recent resurgence in oil prices would already begin to exert a drag on spending.
Another magnitude that I think is important to watch is the share of the budget of an average U.S. consumer that is devoted to energy purchases. This had fallen considerably in the 1990s, making it easier for many consumers to largely ignore modest energy price fluctuations. When this share rises above 6%, it seems to become a more significant factor. The consumer energy expenditure share peaked last summer at 6.8%, but collapsing energy prices subsequently brought it back down to 4.7%. The resurgence in oil prices this summer had pushed that share back up to 5.4% in September.
 |
And the price of oil is up another 15% since September.
If I understand correctly the analysis based on average energy purchases suggests that oil does not have to get all the way upto $130 before it starts being a drag on gdp growth?
Spry: That’s correct– the two figures describe two separate relationships.
How about will more negative real earnings growth for the lower and middle class derail the “recovery” with rising oil prices being one component, especially since the lower and middle class most likely have no more assets to borrow against?
So, where is the promised “green” revolution? It’s tiring to hear the old cliches: fixing bridges and roads to stimulate the economy. We track vehicle sales for signs of recovery, but wouldn’t robust vehicle sales and a rise in miles driven lead to higher oil demand. And as a former US Energy Secretary explained to us last year, for every 1% increase in demand, the oil price should be expected to increase by 20%!!!!! Demand growth of over 1% annually had been the norm prior to the Great Recession. 20% of $80 is $16; should we expect oil at $96 by next year as the recovery takes hold and people run to buy and drive their cars. That’s not counting demand increases coming from China, where GM presumably has brisk vehicle sales. But at least the Chinese say that this car boom is not necessarily a good thing and seem to be trying to chock it off (http://www.chinadaily.com.cn/bizchina/2009-11/11/content_8950478.htm ). In this respect, Buffet’s all-in bet on a railroad is interesting as well. Still, where is the investment in the “green” revolution and why do we still track vehicle sales as a sign of recovery?
It’s actually the fact that oil prices are not rising which will derail this economy.
Take a look at the following chart:
http://tonto.eia.doe.gov/dnav/pet/hist/LeafHandler.ashx?n=PET&s=MTTNTUS2&f=M
Oil imports have followed a large cycle pattern, we are now importing less oil than we did in 1977, and pumping considerably less out of the ground as well.
Either the price is being manipulated resulting in less supply to the U.S. or the economy is just so weak that oil supplies are starting to go elsewhere (ie china)
With decreasing oil supplies this economy has no where to go but down.
less oil=slowing economy
When data are proving a balanced supply and demand in oil,it does not warranty cheaper oil.In all cases the vector difference between supply and demand is called speculation
Should GDP/Oil consumption/supply/demand be correlated should not the resultant that is oil price in 2007 been exhibiting a steadier lower price?
http://peakoildebunked.blogspot.com/2008/05/354-oil-supply-vs-prices.html
PS More time should be allocated to the oil derivatives pattern and the holders of physical stocks.
all of oil from alaska supposedly is exported why don t we use our own oil for us ? why don t we nationalize all the oil production now ? also the loss of millions of jobs that will NEVER come back is going to cap demand in the future . Unfortunately electric cars about to be introduced in this country wll have little effect
because of NO MORE employment or minimum wage
employed people wont be able to afford them…Here in florida we are in a depression and the city i live in raised taxes and it just saps the economic outlook for business ..i had three cars now i have one and it is 8 years old ..i hate to say it but we are doomed .
Thanks for the update
I assume you incorporated the BEA GDP revisions made since the Brookings paper was published.
$130/barrel is predicted by the relationship in Figure 1? Surely a far lower number is justified by the existing weakness in the economy, aside from the view put forward in Figure 2. I would think context counts for a lot here. The “Great Recession” is a unique historical event.
I agree there is a causal link and role of oil shocks and recession. I’ve got a question that I asked Dean Baker on his site, but never got a response (that I know of): If the dollar is generally overvalued (which I think it is), and it returns to more fairly valued level, will the impact of high energy prices due to its devaluation outweigh the boost to the tradable goods sector (exports) here in the US?
1) less oil=slowing economy
2) more oil=growing economy=growing oil price = next recession
It’s not an equation. It’s a system of equations (and it’s a NON linear system!)
If you do consumer spending on energy as a share of consumer spending plus spending on autos you get a very stable ratio. This suggest one of the biggest ways consumers adjust to higher oil prices is to delay buying a new auto.
Of course the long run trend of longer financing periods for auto loans — 48 to 60 months now versus 36 months 20 years ago — makes this more difficult to do.
Maybe you should look at energy plus all durables spending and see how constant that is.
Professor,
With your strong feelings on the price of oil creating our recent economic disaster, why aren’t you a more outspoken opponent of cap-and-trade? Even President Obama has admitted that it will raise energy prices.
I don’t know of anyone who even disputes that the radical environmental policy recommendations now being considered by Washington will led to an increase in energy (oil) prices. That said if rising oil prices create economic disaster doesn’t it follow that cap-and-trade will too?
What was interesting last year is how the price jump in oil seemed to have even less of an effect on growth in the emerging market countries, where a greater proportion of income is spent on energy. Part of that was due to government imposed price caps, and part was due to the fact many are oil producers, if not exporters.
Thanks for this ~ there’s been too little analysis of Great Recession as a function of resource constraints’ impact on growth expectations.
A better analysis would be to: (1.) compose an index of resource costs (a) weighted by their actual use in factor markets & (b) incorporating change in the expected PV of labor costs; and then (B.)model the elasticity against 2 groups of countries: (x) quartile with highest amount of leverage & fixed expense (public & private) to GDP VS. (y) quartile with the lowest amount of leverage & fixed expense to GDP.
This could address the question whether more precise market information about resource constraints (and resource pricing) which arose from @2002 – 2008 caused an adjustment in growth expectations, which in turn had a differing effect based on ex-ante leverage.
If it did, then the stuff in the headlines — what got channeled through the financial system, effective shifting of private debt to public debt, and changes in production, employment, etc. — are nothing more than a by-product of the change in growth expectations hoisted upon the world by resource pricing.
Well, I disagree.
You are using energy consumption, not crude oil expenditures. We did not have a natural gas, coal or nuclear crisis in 1974 and 1979. We had oil shocks, plain and simple, and they dumped the economy into recession with shocking speed–as little as 60 days.
Notwithstanding models, there is no–absolutely no–historical precedent for crude oil consumption expenditures exceeding 4% of GDP and the US not going into recession. This equals $80 oil.
You are suggesting that the US can sustain crude oil expenditures at 6.5% of GDP. Historically speaking, the US has shed oil consumption at aggressive rates during such periods and struggled to get the expenditure level below 4%.
Now, before the recession, the US began to reduce consumption aggressively at $75. Are you suggesting in the recovery it will add oil consumption at nearly twice that price? Recent prices of $70-80 / barrel appear to have locked in US consumption around 18.7 mbpd, materially unchanged since the trough of the recession in May. If the economy is good to $130, shouldn’t we be seeing surging US demand as the country looks to claw back the 10% of oil consumption it lost during the recession?
And, if if the country can’t add oil consumption, will it add employment?
I would be thrilled if this economy could carry on at $130 crude. But I just don’t see it.
JDH,
There is a larger context for rising oil prices: the desire by policy makers for lower real wages. Isn’t the transmission mechanism for monetary stimulus into the real economy falling real wages? I thought the purpose of inflation was to get around the fact that wages are “sticky” in nominal terms. In his, “Essay’s on the Great Depression”, Bernanke fingers a deflationary rise in real wages as the cause of abnormally high, persistent unemployment.
So, therefore, aren’t higher oil prices a necessary link in the chain of monetary transmission?
It appears you are at odds with Bernanke on this one. Are high oil prices good or bad? Are falling real wages good or bad? I would argue the latter given the state of consumer leverage, but then, “leverage” seems to be a four-letter word for the Federal Reserve.
FOr those of you interested in a thoughtful critique of the IEA’s newly-released World Energy Outlook:
http://www.tsl.uu.se/uhdsg/Publications/PeakOilAge.pdf
Dave Cohen: Yes, the new figure uses the revised GDP data. The relationship from which Figure 1 is produced simply assumes that oil would not matter again for GDP over the next three years unless the producer price index for crude petroleum rises above its value from 2008:Q2. As I say, that relation is consistent with the data, but so are a lot of other ways you could have specified the threshold.
Doc: Recently, the percentage increase in the dollar price of oil has greatly exceeded the magnitude of the percentage depreciation in the dollar exchange rate. If that relation continues, I would not expect further depreciation to be as helpful for the economy as others are anticipating.
The housing and stock market bubbles contributed significant wealth effects and subsidized the ability to pay for the extreme oil prices hit in ’06. Looking at the data I see that mortgage equity withdrawals alone contributed almost exactly as much to consumer spending as was ‘lost’ to oil imports. My suspicion is that a lot of these petrodollars were eventually recirculated into the purchase of MBSs, CDOs, and more generally into the world’s stock markets. YES, what I am saying is that there existed a positive feedback loop between the rising housing and stock market bubbles and the rising price for energy. So, at what price will the economic recovery (if you are so inclined to believe in these so-called green-shoots – which my good friend joked about seeing someone trip over on their way to the unemployment line) be stifled? Without the contributions of wealth effects and MEWs to disposable income, the price must certainly be lower. Maybe $80 or $90 IS the new breakpoint…
dandyone, good comment.
Notice the wealth/income inequality effects.
More thoughts. (Did this post earlier?)
So, compared to today, the economic impact of oil at $130 would be the following?
– Total incremental burden on the economy: $360 bn
of which:
– $110 bn to the domestic oil industry
– $75 bn to the Treasury in taxes
– $175 to foreign oil producers, increasing the trade deficit by half
Assuming all spare oil production capacity were committed pro rata among consuming countries, US consumption would rise by approximately 1 mbpd (5%) to 19.7 mbpd, representing a level about 1 mbpd below our mid-year 2007 consumption and almost 2 mbpd below our peak consumption in Dec. 2005.
The cost of each incremental barrel of oil (spread out over the entire consumption burden) would be about $1000 / barrel.
That’s peak oil economics for you.
Are you sure your models do not imply assume either i) supply accommodation (not much here) or ii) demand-driven prices (also not a given here, at least as regards US demand)?
Re: On the other hand, the original research on which that relation is based acknowledged that there’s really not a very compelling basis in the data for choosing among various plausible nonlinear possibilities.
I read your reply, JDH. I’m trying to understand this. Where’s the predictive power if there’s no compelling basis to choose among various non-linear outcomes?
Which is to say–plausibly, I think–that we could be hosed a few quarters from now if oil were to stay at $80 or above.
Passing along another link related to claims of fraud and conspiracy in the oil futures market. In the midst of a bunch of noise there is the interesting claim that non-economic round trip trades are used to set artificially high prices as a false market signal:
Usually oil, gas, and coal track together, so a spike in oil prices means a spike in energy prices more generally.
In this light, I think it is important to note that gas is really cheap right now. And that could help a lot.
What will derail the economy is the realization that the IEA has been playing games with its estimates and that we are already near the all time peak production levels. While this is not catastrophic in a world where individuals are permitted to come up with market solutions it is very problematic in a world where bloated government bureaucracies have gotten in the way of the markets and regulators have disrupted rational developments as they have diverted funding to select groups of politically connected companies and organizations.
While we could see price declines over the short term, particularly during the spring shoulder season in 2010, oil is in a strong secular bull market that will take prices significantly higher. That will be bad news for marginal parts of the economy that depend on low energy prices and cannot pass on costs.
Anything over $70 should be a concern. We need to look back to 2004-2005, that’s when everything really went to crap. On top of the arguments Dr. Hamilton has made, higher gas prices reduced our fuel efficiency, compounding those effects. People slowing down both was mechanically/thermodynamically less efficient and caused more congestion.
While the EPA rating of manufactured vehicles was flat and improved some, and less efficient vehicles sat on lots, our fuel economy declined. It should have been improving.
Higher prices led to slower driving which led to more consumption and higher prices.
http://cumulativemodel.blogspot.com/2009/09/road-traffic-and-fuel-consumption.html
Vangel, the IEA news was interesting. It should have had significant impact on the oil markets if true, but didn’t.
aaron, I don’t think people have been slowing down much in response to higher gas prices. What has occurred is the adoption of hypermiling driving style, which is significantly more energy efficient.
Hypermile style driving includes faster acceleration. The key characteristic is quickly gettting up to an optimal speed and using bursts of acceleration (preferably on a downgrade) to maintain that speed. That’s not what I’ve observed and not what the trend suggests. Since 2005, until the summer of 08, fuel economy declined.
I believe it is largely due to slower acceleration. Texting and talking probably also contributed to delayed and slower starts (delayed starts mean less cars make it through each stoplight cycle) and our aging population has probably slowed down a bit at the gates.
The improvement in 08 is due to less vehicles on the road, not better driving. See INRIX report linked here: http://cumulativemodel.blogspot.com/2009/02/congestion-trends-and-do-two-traffic.html
The past two months’ leg up in oil prices is mostly a matter of dollar depreciation. It’s part of a much bigger picture of how dollar creation is distorting markets and leading to inefficient allocation of resources, in this case by re-allocating wealth from ordinary Americans to Russian officials and Middle Eastern sheiks. That said, this is an inherent vulnerability of the suburban lifestyle.
S
My view is that the damage has already started and is ongoing, beginning with the restoration of the 70-80 dollar level starting 5 months ago. Let’s consider that the US economy went into recession in late Q4 2007 (just using the official marker) with much lower unemployment and oil having been in a 60-80 range that year, before breaking higher. (BTW, I am not making a remark just yet about causality I just want to establish the setting).
Now let’s consider that unemployment in states that are the most leveraged to the Automobile, states like California, Florida have soaring unemployment. Petrol at 3.00 dollars and above has to be at least as damaging now as the 4.00+ gasoline was starting in late 07 and into 2008.
The oil shock of 06-08 essentially served the purpose of unmasking the credit bubble, over two decades in the making. No doubt the rising price of petrol was also placed on credit balances.
Now that we’re in the aftermath of the credit bubble’s burst, not only do we have a smaller economy, fewer jobs but we also have less credit to consume the oil. I think we’re getting crushed. But 75 dollar oil is falling over a different economic landscape.
G
Gregor, I wonder if the linkage of the states with the soaring unemployment and their being highly tied to the automobile have a lot to do with asset price inflation of housing. You had a “drive till you qualify” phenomenon going on where cheaper housing was being built further and further away from jobs increasing commute distances. Also, cars have become more durable in the last two decades allowing more mileage to be accumulated, encouraging increasing commute distances as well. Consumers do not have enough cushion in their budgets to handle wild price swings and buying inflated housing further and further from where they work makes all that worse.
Does the USA know something that other rich OECD countries do not know?
See: Petrol taxes from Economist.com
Thanks for doing this JDH. Most appreciated.
What approximate portion of that 5.4% energy intensity number consists of oil? Oil has gone up, natural gas-generated heat and electricity costs have gone down, and energy prices driven by other sources have stayed relatively flat if I’m not mistaken.
I would guess that threshold price of oil or energy intensity level at which major changes in budgets and behaviour are made is now lower that what it was earlier in the decade. Presumably some agents are forward looking and these US$70-US$80 benchmark oil prices will reinforce expectations of higher future prices.
GNP:Gasoline and oil constitute 62% of these consumer energy expenditures. Electricity and natural gas are most of the rest.
JDH,
What do you think of the Philadelphia Fed paper which suggested that the economic effect of oil shocks is temporary?
It concludes that a 10% decline in oil availability would reduce GDP, on a temporary basis, by about a cumulative 2%. This means that GDP growth would be 2% lower than otherwise in very roughly the 2 years following the oil shock, then go back to it’s historical growth rate.
http://www.postpeakliving.com/downloads/Sill-MacroeconomicsOfOilShocks.pdf
I have no doubt in my mind that the current range of oil price is going to break to the upside very soon.. from a charting perspective this range from $80 to $70 looks like a bull flag and upside should see $100 touched once again..
Oil price chart
I’m sure you are aware of the work of Andrew Oswald, et al, (including Mark Hooper) of Warwick University in the late 1990s which demonstrated a clear correlation between the price of oil combined with the interest rate in leading economic recession.
You could have used it, and he did, to predict the dot.com bust. At the time it was the New Economy, you will remember, with probably fewer naysayers than even the housing bust.
One commenter speaks about the evils of cap-and-trade with this perspective. Better would be a simple tax or the cap-and-dividend of Cantwell-Collins, but insofar as the proceeds are fed into government spending, it should be a net plus, since oil produces the fewest jobs per dollar of anything and federal spending may be at the other end.