The net job loss in the December nonfarm payroll (NFP) is unwelcome news, but given the (upward) revision in the November figure, one shouldn’t think of this number as fixed. Figure 1 shows various employment series.
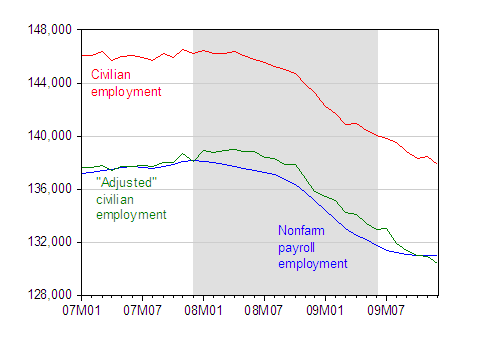
Figure 1: Nonfarm payroll employment (blue), civilian employment (red) and civilian employment “adjusted” to conform to payroll concept (green), all in ‘000s. NBER defined recession dates shaded gray, assuming last recession ends 2009Q2. Source: BLS December 2009 release, via FRED II, and NBER.
The more volatile household based civilian employment series exhibits continued downward movement.
What about the distribution of job losses? In Figure 2, I plot total employment relative to 2007M12, for total NFP, as well as for certain categories.
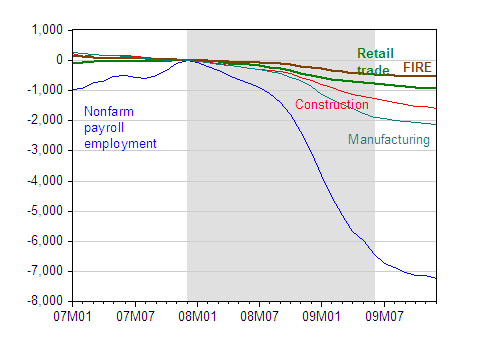
Figure 2: Nonfarm payroll employment relative to NBER defined peak (blue), construction (red), manufacturing (teal), retail trade (green bold) and finance, insurance, real estate-“FIRE” (brown) relative to 2007M12. NBER defined recession dates shaded gray, assuming last recession ends 2009Q2. Source: BLS December 2009 release, via FRED II, and NBER.
I’ll merely observe that finance, insurance, real estate (FIRE) hardly seems to me like a large component of the overall drop in employment. And for all the hullaballoo about the end of the consumer society, employment in retail trade has not accounted for most of the decline (although 0.9 million is not inconsequential, and does represent a big departure from trend). Rather, the biggest hit has been to manufacturing, which is highly procyclical.
In my last post on the employment situation, I cited the Valletta and Cleary (2009) piece which noted little evidence that there had been a large increase in structural unemployment. Dr. Valletta has updated his assessment in a personal communication.
I’ve updated the sectoral dispersion and related analyses into fall 2009, and I’ve also done some additional analyses (e.g., unemployment duration by industry) — nothing written up yet, though. The updated data don’t appear to provide any more support for the sectoral reallocation interpretation of elevated unemployment (and the expected recovery path) than the data through mid-2008 did. Dispersion of employment growth has continued to grow, but the extent and pattern appear largely consistent with the usual cyclical pattern of unbalanced job losses in a recession (a la Abraham and Katz in JPE from the mid-80s). Some of the evidence that I’ve uncovered suggests that workers who lost jobs in the financial sector (but not construction) are facing an unusual degree of difficulty for finding new jobs, but the number of such searchers isn’t large enough to have major implications for structural unemployment.
Bottom line: no problem with extrapolating from mid-2008, the facts and arguments don’t appear to have changed materially.
Additional research, with similar conclusions, has been conducted by Chicago Fed economist Ellen Rissman [1].
I thought it of interest to examine government employment, noting the impact of employment associated with the 2010 Census.
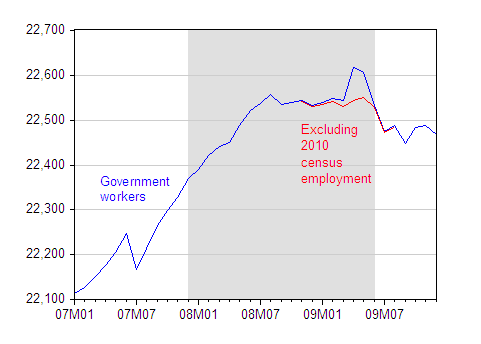
Figure 3: Government employees (blue), civilian employment (red) and civilian employment “adjusted” to conform to payroll concept (green). NBER defined recession dates shaded gray, assuming last recession ends 2009Q2. Source: BLS December 2009 release, via FRED II, and NBER.
Even taking out the Census-related workers, government employment has been declining.
One bit of good news is that aggregate hours do seem to be rising, even if private employment is still declining.
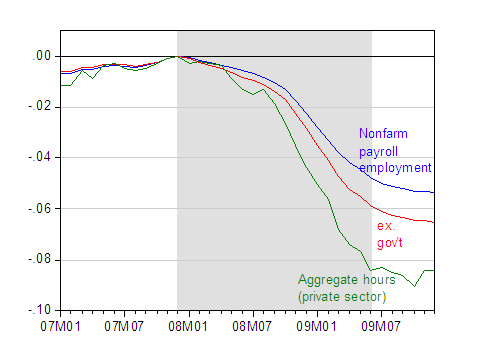
Figure 4: Nonfarm payroll employment relative to NBER defined peak (blue), private sector employment (red) and aggregate weekly hours (green), all in logs. NBER defined recession dates shaded gray, assuming last recession ends 2009Q2. Source: BLS December 2009 release, via FRED II, and NBER.
Finally, the employment numbers are an input into real time estimates of GDP.
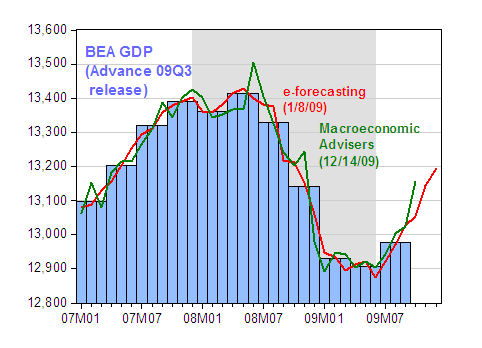
Figure 5: Real GDP, 3rd release for ’09Q3, in billions of Ch.2005$ SAAR (blue bars), e-forecasting release of 8 January (red line), and Macroeconomic Advisers release of 14 December (green line). NBER defined recession dates shaded gray, assuming recession ends in 2009M06. Source: BEA, e-forecasting, Macroeconomic Advisers and NBER.
e-forecasting notes that these figures imply a SAAR q/q growth rate for GDP of 5%; Macroeconomic Advisers forecasts 4.2% (as of 12/14).
Update 1/9/10 10am Pacific
Chris Vavares of Macroeconomic Advisers is quoted in RTE/Hilsenrath as now forecasting 5.4% q/q growth (SAAR) in 09Q4.
RTE/Izzo also makes note of the possible impact of weather. Below, I plot the standard (seasonally adjusted) series and the unadjusted series.
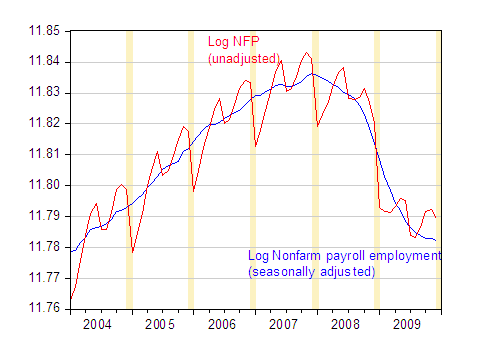
Figure 6: Log nonfarm payroll employment, seasonally adjusted (blue), and NFP (red). Shaded areas denote December-January. Source: BLS via St. Louis Fed FRED.
One thing to notice is that the drop in 09M12 is larger than the average drop over the past twenty years. Running a regression over the 1989M01-09M12 period, one finds the annualized drop in December is 1.2% (log terms), while the December 2009 drop was 3.6%.
Update 1/10/10 6:20PM Pacific
Here’s a breakdown of government employment into state, and local employment. However, in contrast to this Economix post, these series exclude the education component.
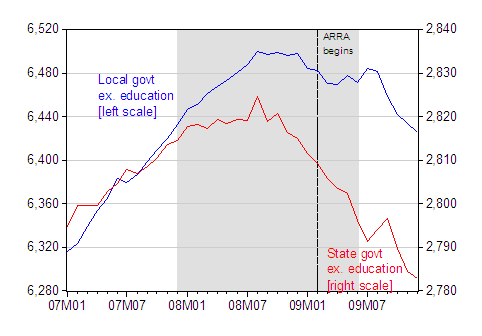
Figure 7: Local government employment, ex. education (blue), and state government employment ex. education (red). Shaded areas denote NBER defined recession, assuming trough at 2009M06. Source: BLS.
Menzie-
The only glimmers of brightness your charts show are:
Consumer borrowing dropped big in the November report released today. This is consumer credit ex mortgage and MEW.
I think the V shaped recovery forecasters are missing this dynamic, but we have the fiscal deficit and also might just forgive everyone’s debt, so you never know, we might get nice looking charts after all. Not sure I’d bet against it.
“The Federal Reserve said Friday that total borrowing dropped by $17.5 billion in November, a much bigger decline than the $5 billion decrease economists had expected.”
http://finance.yahoo.com/news/Consumer-borrowing-falls-apf-526281786.html?x=0&sec=topStories&pos=6&asset=&ccode=
Mark A. Sadowski warned that he is lurking, so I wanted to let Mark know I just bought a new German convection oven from Amazon.com and it says made in China on it. I also bought three pairs of tennis shoes at Walmart(I go thru a lot of tennis shoes)for the unbelievable price of $12 each. They say made in China too. But I’m doing what I can to help. But I still think we may need to make economics illegal.
Menzie,
You may want to compare the service sectors cited to previous recessions. Did they add jobs through the recession? What percentage of job loss did they constitute? Is something materially different going on this time?
Its quite obvious the “manufacturing” is a catch-all category of goods-producing jobs, whereas you are breaking the service sector into specific slices. By doing so, you are missing the larger point: services account for the majority of job losses in this recession, and this has never happened before. The duration of unemployment is also far above prior peaks.
Something is clearly different this time. This raises questions that should be discussed, and not ignored, in analyzing whether the current job loss experience is cyclical or structural.
Menzie–I’m sorry, but this is well beyond seeing through rose-colored glasses. May I offer a different, more comprehensive picture from Jake at EconomPic: http://econompicdata.blogspot.com/2010/01/hours-worked-per-civilian-per-week.html
That graphic shows that hours worked per civilian per week has dropped to its lowest level in more than 45 years–the range of the graphic. Moreover, the steep decline started ca. 2006, well before the bubble burst.
How anyone can argue that this is a more-or-less normal cyclical turn in unemployment in the face of this evidence is beyond me.
One note: There is nothing “real” about “real time” GDP estimates. In fact, we can’t get it right for months after a quarter.
Terry: Multiplying variables from different surveys (household and establishment). I will have to think about what this variable means.
One obscure fact that I haven’t seen anyone mention so far is that the latest BLS jobs report showed that payroll employment actually increased in November after revisions (up by a measly 4000). This was the first increase since december 2007 but may itself be revised away next month. But the point is with so many people speculating about when payroll numbers will turn positive everyone seems to have missed the fact that they may have already even if for only one month.
@Cedric Regula
What are you helping exactly? To boost German and Chinese GDP? Also, what’s your occupation, just so I can suggest that it be made illegal too?;)
Mark A. Sadowski
I’m boosting my aggregate demand.
I started in engineering, then retired from computer programming.
They are illegal in this country already.
I just listened to Christina Romer’s comments on the unemployment problems and she has lost all sense of reality. She says yes we have created a bad situation and no our stimulus plans are not working but trust us we know what is best and besides all of our actions have worked even thought it looks like they haven’t.
I can’t believe I actually ever thought she might be different.
Then Obama says “We will do whatever is necessary…” when he actually means he will do everything except what works. His administration owns the unemployment rate and it is getting worse.
I have been reading about the intellectual fight Robert Mendel had with the economics and political elite during the LBJ and Nixon administrations. He saw the way but they were blind and we had economic disaster of their making through the 1970s. The same thing is happening now. Those in power are afraid to do the right thing because it would take away their power.
Tell me, do you think Ben Bernanke would be on the cover of Time as the Man of the Year if had solved the problems in our economy? Or to put it another way, do you think Ben Bernanke would be on the cover of Time as the Man of the Year if he hadn’t screwed up our economy royally?
Think about it. If he does the right think he becomes irrelevant.
If I sound angry I am. It is sick that these are so narrow that they would put our country through this for their own aggrandizement.
I’m starting to believe that serious trade-leveling and tax adjustment moves have to be made, as the disconnect between 5.4% growth and a continued lack of jobs being created continues. The stimukus has worked in stopped the financials freefall we were in a year ago, and has worked in targeted areas with short-term (i.e. STIMULATIVE) policies like Cash-for-Clunkers and the housing tax credit, which is why GDP has turned around. But as David Pearson notes, something is not right at all in the real-world economy, and the only things being created past the current quarter is wealth, not consistent growth in incomes and not tangible products. I’d gladly cut that GDP growth rate in half to turn that -85,000 in December into a +85,000.
As Menzie had brought up in the past, 2/3 of our fiscal deficit is due to this economic downturn, which means jobs and economic certainty have to be the trick going forward. Get health care reform known and finished quickly, install targeted protectionism, and combine that with the large amount of green infrastrucutre tax credits that have just hit. Our current composition of jobs isn’t cutting it, and any short-term adjustment that results from it can’t be any worse than the direction we’ve been going for the last 3 years.
Net jobs is the bigger indicator to me than the (9.975%) unemployment rate, because I think U-3 will go up over the next 6 months even if there is an increase in payrolls, as discouraged workers have been the only thing keeping the rate below the October highs in the last 2 months.
Here are 3 posts I wrote about the employment report. The drop in the employment rate (employment to population ratio) showed no sign of slowing and the durration of Uemplloyment numbers are really scary.
http://www.zacks.com/stock/news/29113/Employment+Numbers+Disappoint
http://www.zacks.com/stock/news/29123/Unemployment%3A+Sectors+%26amp%3B+Demographics
http://www.zacks.com/stock/news/29127/Unemployment+Duration+Still+Increasing
If Q4 growth really is above 4 does this suggest that the relationship described in Okun’s Law is fundementally broken?
Menzie, its good that you noted the Household data shows continued decline in jobs for November. Calculated Risk shows JOLTS data today that says jobs in November declined 164,000, and job openings remain at a decade low. Its very hard to believe the BLS payroll report when one looks at other sources and related data. Its very easy to believe the payroll jobs data will be adjusted down significantly (like hundreds of thousands of jobs) when the benchmark revisions are folded in.