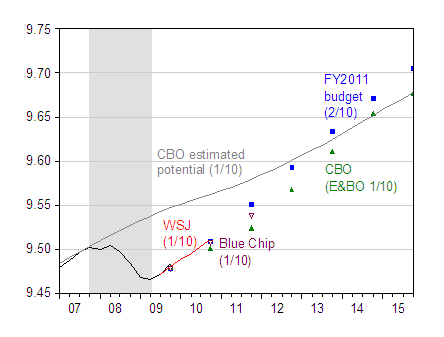
How does the Administration’s forecast of the levels of real GDP compare against those of the CBO, and the Blue Chip and Wall Street Journal surveys?

Figure 1: Log GDP (black), Administration forecast in FY2011 budget (blue square), CBO forecast/projection (green triangle), Blue Chip January forecast (inverted purple triangle), mean WSJ January forecast (red line). Sources: White House, FY 2011 Budget: Analytical Perspectives Table 12-2, CBO, Economic and Budget Outlook Summary Table 2, WSJ January survey.
Note that the Administration’s forecast (from the Troika process) was set (or “locked down”) in early January, before the 2009Q4 advance GDP release. The CBO’s forecast was finalized December 8th. Hence, I have generated the forecasted levels for 2009Q4 GDP from the forecasted 2009 Q4/Q4 growth rates. The actual advance release for 2009Q4 GDP is therefore higher than the forecasted.
Short term outlook
The Administration’s discussion of the GDP forecasts from the Analytical Perspectives (Page 14) reads thus:
Real GDP.–The Administration projects the economic recovery that began in the second half of 2009 will continue in 2010 with real GDP growing at an annual rate of 3.0 percent (fourth quarter over fourth quarter). In 2011-2013, growth is projected to increase to around 4-1/4 per-cent annually as underutilized economic capacity returns to productive uses.
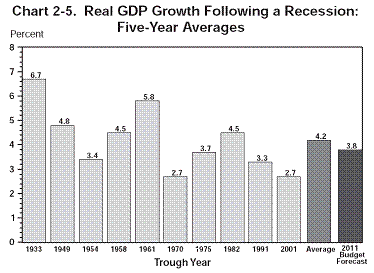
As shown in Chart 2-5, the Administration’s projections for real GDP growth over the next five years imply a recovery that is a bit below the historical average. It is true that recent recoveries have been somewhat weaker, but the last two expansions were preceded by relatively mild recessions, which left less pent-up demand when conditions improved. Because of the depth of the recent recession, there is much more room for a rebound in spending and production than was true either in 1991 or 2001. On the other hand, continued weakness in the financial sector may limit the pace of the recovery. Thus, on net, the Administration is forecasting a recovery over the next five years that is slightly below historical averages.

Chart 2-5 from FY 2011 Budget: Analytical Perspectives.
Note that this average post-recession growth rate pertains to the previous ten recessions. If post-recession growth rates depend on the depth of recessions, then one could argue that the 3.8% forecast is too low ERP, 2009. Working the other direction is the fact that this recession was conjoined to a financial crisis.[1] [2]
The CBO’s forecast for 2011 is noticeably more pessimistic than either the Blue Chip or Administration forecast. The CBO’s forecasts of particularly sluggish growth are driven by the following three (familiar) points:
- Economic growth will probably be restrained by the
aftermath of the financial and economic turmoil.
Experience in the United States and in other countries
suggests that recovery from recessions triggered by
financial crises and large declines in asset prices tends
to be protracted.- Although aggressive action on the part of the Federal
Reserve and the fiscal stimulus package enacted in
early 2009 helped moderate the severity of the recession
and shorten its duration, the support coming
from those sources is expected to wane. In addition,
under the assumption that current laws and policies
remain unchanged — an assumption that is reflected
in CBO’s forecast — tax rates will increase in 2011,
further hampering growth.- Household spending is likely to be dampened by slow
income growth, lost wealth, and constraints on households’
ability to borrow. Investment spending will be
slowed by the large number of vacant homes and
offices.
In addition, CEA Chair Romer observes in a briefing on the budget:
Now, the forecast that the Congressional Budget Office released last week was considerably more pessimistic about both 2010 and 2011 than either of the administration forecasts or the Blue Chip consensus. And, actually as CBO noted in its release, they’re required to make forecasts under the assumption that none of the Recovery Act provisions are extended; there’s no new jobs bill enacted. And all of the 2001 and 2003 tax cuts expire at the end of the year.
CBO’s report was careful to explain that under the assumption that some of these policies will be extended, its forecast would have looked much more similar to other forecasts.
Longer term outlook
Over the longer term, the deviation appears to be driven by differences in views regarding potential GDP growth. The Administration explains its views on page 16:
Longer-Term Growth. — The Administration forecast does not attempt to project cyclical developments beyond the next few years. The long-run projection for real economic growth and unemployment assumes that they will maintain trend values in the years following the return to full employment. In the nonfarm business sector, productivity growth is assumed to grow at 2.3 percent per year, while nonfarm labor supply grows at a rate of around 0.7 percent per year, so nonfarm business output grows approximately 3.0 percent per year. Real GDP growth, reflecting the slower measured growth in activity outside the nonfarm business sector, proceeds at a rate of 2.5 percent. That is markedly slower than the average growth rate of real GDP since 1947 — 3.3 percent per year. In the 21st Century, real GDP growth in the United States is likely to be permanently slower than it was in earlier eras because of the slowdown in labor force growth that is expected beginning with the retirement of the post-World War II “baby boom” generation.
According to the Administration, the Administation and CBO forecasts differ for the following reasons (page 16):
Real GDP Growth.–The Administration’s real GDP projections are very similar to those of the Blue Chip consensus in 2010 while exceeding the consensus view in 2011. In its August 2009 projections (the most recent available) the Congressional Budget Office (CBO) projected
long-run growth of 2.2 percent per year. Most of the difference between the Administration and CBO’s long-run growth comes from a difference in the expected rate of growth of the labor force. Both forecasts assume that the labor force will grow more slowly than in the past because
of population aging, but the Administration bases its population projections on the Census Bureau’s projections,
which tend to run higher than the CBO projections. The Administration also believes that labor force participation
could be somewhat stronger in the future. The net difference in the two forecasts is only a few tenths of a percentage point.
Since the newly released CBO estimates of potential GDP (which the Administration did not have available at the time of the writing of the Budget) are even lower than those from January 2009, this foregoing assessment still applies.
One of the most destructive things that Hoover did to worsen the Great Depression was to influence businesses to keep wages and prices from falling in the face of weakening demand. The result was a squeeze of business profits leading to business failures, contraction, and unemployment.
For a small business to take advantage of President Obama’s recommended tax credit for creating jobs a company must demonstrate that wages are kept high. There is much in the administration’s budget that appears to be out of the Hoover playbook.
GDP may increase as a measure of increased government spending, a reflection of private sector monetary starvation.
Richardo you are using a theory for which there is absolutely no actual data to support.
I keep asking people advancing that theory to show me an actual example of the theory working. No one has ever shown me a single example of economy wide wage cuts leading to greater employment.
RicardoZ makes a good point. We’ve all been reading about Greece’s travails with overly large deficits, inappropriately low interest rates, overly high wage inflation, and lack of competitiveness. All of which applies to the US.
Of course the US, with all its huge economic advantages over Greece, can sustain a creeping loss of its competitiveness for far longer. But the longer it goes on, the more the piper will eventually have to be paid, and there’s really only one way to pay him: real wage cuts. Think of what happened in Reagan’s first years, only worse, and not confined to the working classes.
Wages in 1929 1930 had swing pattern among industries branches when using 1926 as base 100
January 1930
Chemical 99.1
Paper 106.3
Food processing 99.9
Electricity 118.3
Naval construction 120.9
Source P Claudel French ambassador in the USA 1926 1930
The oddity unemployment did not drive salaries down (the paper industries salaries were persistently going up)
I will not rush either, to conclude that when unemployment goes up salaries go up.
Spencer, if you check out the deep recession of 1921, I think you will find the example you are looking for. It was the last recession in which the gov’t did not intervene & indeed reduced spending…that is to say, reduced its burden on the economy.