A couple days ago, I presented my views on the policy response to the financial crisis and the Great Recession in a UW Center for World Affairs and the Global Economy / UW CIBER / MITA and ICE sponsored event. The power point slides are here (big file, 1.3MB). I took the latitude as the invited speaker to expand the topic from the Obama Administration’s measures to encompass the response to the crisis and recession from both the fiscal and monetary policy authorities.
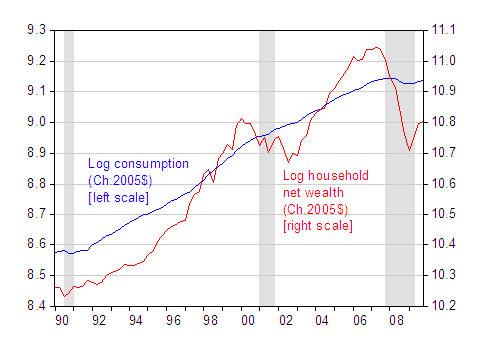
One slide I generated for the talk is of particular interest, when thinking about the combination of monetary and fiscal policies — it is the plot of consumption and household net wealth.

Figure 1: Log consumption, Ch.2005$ SAAR (blue, left scale) and log househld net wealth (red, right scale), Ch.2005$, deflated using PCE. NBER defined recession dates shaded gray; assumes last recession ended 09Q2. Source: BEA, GDP 09Q4 2nd release; Federal Reserve Board, Flow of Funds, March 11, 2010.
What is quite remarkable is the fact that real consumption expenditures have been essentially flat for a year and a half — even at a time when population has grown. (Since 08Q2, consumption has fallen 0.6 while population has risen 1.3%.) One question is whether the rebound in net wealth will support a resumption in consumption growth even as disposable income growth remains lackluster.
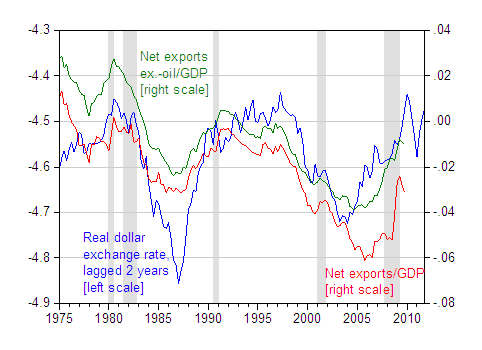
Another slide, pertaining to the rebalancing issue, is an update of my net exports/real exchange rate graph.

Figure 2: Log US dollar real broad exchange rate, lagged two years (blue, left scale), net exports to GDP (red, right scale), and net exports ex.-oil to GDP (green, right). NBER defined recession dates shaded gray; assumes last recession ended 09Q2. Source: BEA, GDP 09Q4 2nd release; Federal Reserve Board; and NBER.
If previous patterns hold, then — to the extent that the 08Q4-09Q2 dollar appreciation was understood to be transitory — the trade balance (at least the ex-oil component) should not deteriorate substantially going forward. This conclusion is consistent with the October IMF WEO discussed in this post.
As I’ve mentioned before, continued progress in keeping the trade deficit relatively small depends in part upon the trajectory of consumption. A resumption of consumption growth would be — all else held constant — desirable, but would tend to worsen the trade deficit. An exogenous upward shift in US exports would relax that constraint (as would further dollar depreciation). This is why the Obama administration has stressed export promotion [1] [2].
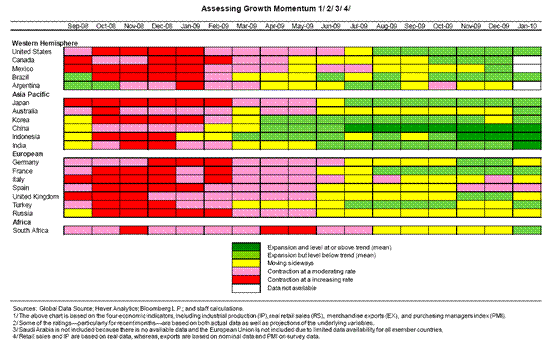
On a slightly different matter, the IMF provided an interesting heat map summarizing growth across the G-20, in this Staff Position Note.

Figure from IMF Note on Global Economic Prospects and Policy Challenges, February 27, 2010 – Seoul, Korea.
The map highlights the two-speed nature of the global recovery.
Update: 7:30am, Pacific
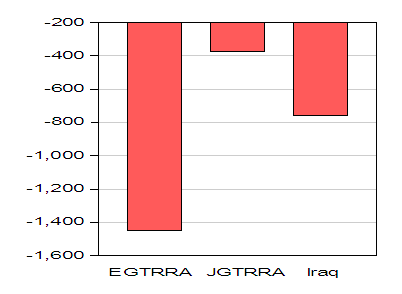
One of the graphs that didn’t make it into the presentation is an elaboration of how certain fiscal measures — EGTRRA, JGTRRA, and the total cost of operations in Iraq — limited the fiscal space available to policy makers. In the absence of these measures, we would not have to worry so much about rising debt-to-GDP levels. In other words, deep recessions are the times to run deficits, not in non-recessionary times.

Figure 4: Impact on budget balance, in billions of FY2010$, for EGTRRA; for JGTRRA; and budget authorization for operations in Iraq, FY01-FY10. Source: CBO, Budget and Economic Outlook: An Update (August. 2001), Table 1-4; CBO, Budget and Economic Outlook: An Update (August 2003), Table 1-8 (revenue implications only); A. Belasco, The Cost of Iraq, Afghanistan, and Other
Global War on Terror Operations Since 9/11,” Congressional Research Service report RL33110 (September 28, 2009), Table 3..
I first made this point about fiscal space (although I didn’t use the phrase) in 2006 [3].
Regarding your statement that “deep recessions are the times to run deficits, not in non-recessionary times,” I assume this means you find the President’s budget proposal, which projects enormous deficits for the coming decade even with good economic growth, deeply irresponsible. Correct?
Do you tink really that the Obamas fiscal policy is not a charge to growth? I think the speeded interest rate slope curve says al least an ambigous message: the optimist and the opposite.
Menzie, nice book f’coming 2011. Better you change the title, “Lost Decades” sounds exaggerated-
your readers may get depressed.
Mr. Chinn,
What do think are the prospects of net household wealth increasing, or even remaining stable going forward? I can identify two pressing issues:
Declining residential real estate, and
Massive income deflation or unemployment as states inevitably address their budgetary imbalances.
On the consumption side, could not the data be distorted by the raising of banking fees and interest rates, which were substantial–the recentness of these actions they have to resolve themselves into a stable pattern–; and of course this “consumption” would not migrate into the trade data. Also, we have yet to clear the housing market, and in this regards we probably have a great many people living in their current dwellings without the costs of the mortgage–or in effect what we have is double counting with the banks counting that mortgage as being paid, yet the “savings” of the resident is being spent in other parts of the economy that otherwise wouldn’t be: basically what some refer to as the backdoor stimulus. Further, we may also be getting a distortion in transfer payments that are only temporary in nature; or potentially we’re getting inflation in the food market (the great quantity of food stamp issuance–and of course compounded by the problem with climate failures to deliver healthy crop yields (but this could be factored out, possibly if these crop numbers are not a long term trend).
I suppose we have an RMB revaluation as a wild card, or a governmental action in the form of tariffs–however, at least for me, I find it somewhat alarming that the Chinese have not already revalued the RMB; it just makes me wonder if they’re seeing something that others are not (such as the Chinese government hiding massive losses and bankruptcies, or even the 1998 Asian crisis losses were swept under the rug, now to rear an ugly head). This is all speculation, so it’s probably best to leave it aside.
“(Since 08Q2, consumption has fallen 0.6 while population has risen 1.3%.)”
Where does the population figure come from? Is it an extrapolation? Might it be wrong?
Re: your first graph – I recall seeing a graph in an old Samuelson textbook showing consumption on income – a remarkable straight line.
An addendum to my above post: if this WSJ article is correct that Chinese exporters actually do have only a 2% profit margin (or less?!) than certainly it’s much more unlikely of an RMB upward revaluation, which in turn might increase or maintain current US Chinese imports. A 2% profit margin sounds a bit too extreme to me from what I’ve seen with the Chinese markets, but I do suspect that profit margin is not that much greater in terms of percentage points, maybe upwards to 3-4% (perhaps, though, Chinese exporters do not receive any special tax breaks, which would be unusual given their political clout).
However, US governmental action in regards to tariffs is still up in the air–and how the Treasury will rule next month currency findings (I suspect they’ll rule that China is not manipulating its currency, but since the finding is more political than economic, a lot can happen unitl then).