From the April 2010 employment situation release: Nonfarm payroll employment trends strongly upward; previous months’ figures are revised upward; not seasonally adjusted figures move upward as well; the upward movement is not driven by government employment; the experimental household based quasi-payroll employment series moves upward even more strongly; and aggregate hours is now 1% higher than the level at 2009M06.
From the BLS summary:
Nonfarm payroll employment rose by 290,000 in April, the unemployment rate edged up to 9.9 percent, and the labor force increased sharply. Job gains occurred in manufacturing, professional and business services, health care, and leisure and hospitality. Federal government employment also rose, reflecting continued hiring of temporary workers for Census 2010.
Actual was 290K, versus Bloomberg consensus of 200K [0].
Here are five supporting graphs:
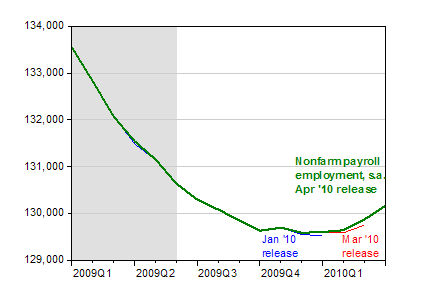
Figure 1: Nonfarm payroll employment from April 2010 release (green bold), March release (red) and January release (blue), all in ‘000s, seasonally adjusted. NBER defined recession dates shaded gray, assuming last recession ends 2009M06. Source: BLS various releases, via FRED II, and NBER.
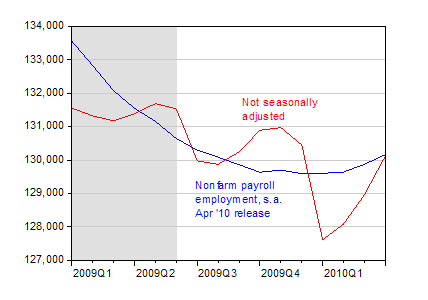
Figure 2: Nonfarm payroll employment, April 2010 release, seasonally adjusted (blue), and not seasonally adjusted (red) all in ‘000s. NBER defined recession dates shaded gray, assuming last recession ends 2009M06. Source: BLS April 2010 release, via FRED II, and NBER.
If you thought this upsurge was driven by government employment, you’d be wrong.
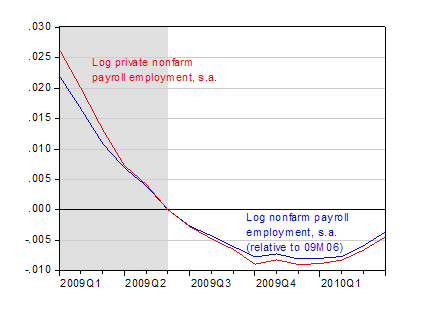
Figure 3: Log nonfarm payroll employment, relative to 2009M06 (blue), and log private nonfarm payroll employment (red), both seasonally adjusted. NBER defined recession dates shaded gray, assuming last recession ends 2009M06. Source: BLS April 2010 release, via FRED II, NBER, and author’s calculations.
Nonfarm payroll employment has increased by 143K per month so far this year, and private sector nonfarm payroll employment by 121K. The former figure exceeds the Administration February forecasts for monthly employment gains throughout 2010.
If you mistrusted the establishment series, then your pessimism would find no succor in the household series adjusted to conform to the nonfarm payroll employment concept.
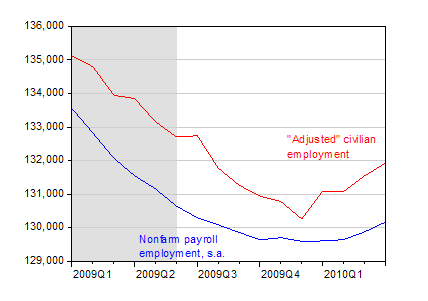
Figure 4: Nonfarm payroll employment (blue), and civilian employment “adjusted” to conform to payroll concept (red), all in ‘000s, and seasonally adjusted. NBER defined recession dates shaded gray, assuming last recession ends 2009Q2. Source: BLS April 2010 release via FRED II, BLS and NBER.
What about hours? Aggregate hours worked in the private sector have now risen above levels at the GDP trough at 2009M06, and about 1.5% 2% (log terms) above own-series-trough.
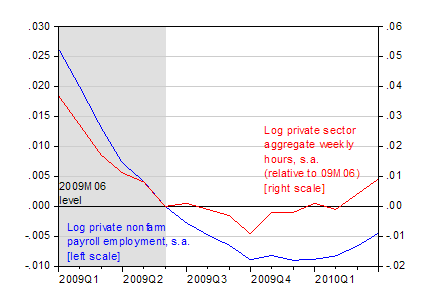
Figure 5: Log nonfarm private payroll employment (blue), and log private aggregate weekly hours (red), both seasonally adjusted, and relative to 2009M06. NBER defined recession dates shaded gray, assuming last recession ends 2009M06. Source: BLS April 2010 release, via FRED II, NBER and author’s calculations.
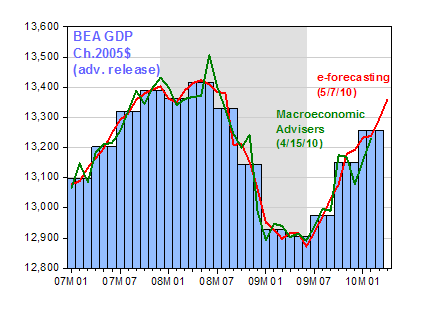
Other measures of economic activity are moving up, as Jim Hamilton has pointed out. Here are some high frequency measures of GDP.
<
Figure 6: Real GDP, advance release for ’10Q1, in billions of Ch.2005$ SAAR (blue bars), e-forecasting release of 7 May 2010 (red line), and Macroeconomic Advisers release of 14 April (green line). NBER defined recession dates shaded gray, assuming recession ends in 2009M06. Source: BEA, e-forecasting, Macroeconomic Advisers and NBER.
More from WSJ RTE here
Interesting aside: I get dueling emails from the two sides of the US Joint Economic Committee. From Chair Maloney:
Washington D.C. — Congresswoman Carolyn B. Maloney, Chair of the Joint Economic Committee (JEC), released the following statement on the Bureau of Labor Statistics’ April jobs report showing that the unemployment rate increased to 9.9% and 290,000 total nonfarm jobs were added:
“The job growth in April builds on progress from last month and is the strongest job creation we’ve seen since March 2006. In the past two months, the economy has added more than a half million jobs, with more than 400,000 of those in the private sector. The April jobs report provides more evidence that the actions taken by Democrats in Congress are working and the economy is recovering.
However, the increase in the unemployment rate makes clear that we will need stronger economic growth in the months ahead to regain the 8.4 million jobs lost during the recession and to put all unemployed Americans back to work. The unemployment increase is due to new entrants and re-entrants to the labor force, a sign of increased optimism about job prospects. The labor force increased by 805,000 in April. Since reaching a low in December, the labor force participation rate has increased in each of the last four months.
While we have made significant progress in the past 15 months, Congress must take additional actions to boost employment, including expanding lending to small businesses and strengthening job training for workers. We need to keep our eye on the ball, which is jobs, jobs, jobs.”
From lead House Republican Brady:
Washington, DC — In a very mixed Employment Report, the unemployment rate rose to 9.9% in April and long-term unemployment rose to an all-time record high of 6.72 million Americans. Nearly 46% of jobless Americans have been out of work for more than half a year now even as U.S. economy added 290,000 jobs in April with the help of 66,000 temporary Census jobs.
“A painfully slow job recovery is better than no recovery, but for the nearly 15 million Americans out of work who are waiting for Washington Democrats to finally focus on jobs, this report has got to be disheartening,” said U.S. Congressman Kevin Brady (R-Texas), the lead House Republican on the Joint Economic Committee. “At this slow pace it will take much of the decade to return to normal employment levels.”,,,
There is no job growth yet. The economy hasn’t even reached parity yet.
The problem is the BLS and their pathetic way of calculating “job growth”. When the yearly revisions come in, the “job growth” will say goodbye.
Where’s the “V”… there was supposed to be a “V” !!
Well, at least it’s not going down… although the YOY numbers haven’t turned the corner yet.
How much debt did we take on to achieve this minor rebound, again?
A trillion dollars for a million jobs works out to $1,000,000 per job… Hope we do better than that…
Completely OT:
Could we have an LDC (Lowest Common Denominator) Disclosure Law? In many industries, the degree of disclosure in uneven. For example, in subsea production, FMC discloses everything: orders, revenues, backlog. GE, by contrast, discloses none of these because its Vetco Gray unit is buried three levels deep in the corporation.
It would be nice if we had a law that requires companies to disclose information at the level of the most disclosed competitor in the segment. This would go a long way to leveling the disclosure playing field.
As often happens in the early stages of a recovery, the payroll survey is likely understating job growth.
The Household survey does a much better job of capturing the actual trend at this point of the business cycle.
http://preview.bloomberg.com/news/2010-05-07/payrolls-may-undercount-u-s-jobs-as-household-survey-suggests-bigger-jump.html
I’ve been keeping an eye on the employment to population ratio mainly because it takes into account population growth. Between December 2009 and April 2010 the ratio has risen from 58.2% to 58.8% or an increase of 0.6 points.
Such a rapid increase over a four month period of time is not unknown but it hasn’t occurred since November 1994. Other episodes of equal or greater magnitude occurred in 1948, 1950, 1955, 1959, 1964, 1968, 1973, 1977-78, and 1983-84. I’m curious to see if this continues.
Menzie—What everyone wants to know is how many of these jobs are attributable to Obama’s stimulus???
And, what will happen after 2Q when the stimulus starts to wear out?
Your thoughts?
Mr. Chinn,
You’re beginning to sound like one of those many famous headlines of 1930/31 proclaiming to have turned the corner (for now). The jobs so far lost have been primarily in the private sector: you don’t seriously believe or suspect that local and state governments will be able to hold on to the current employment situation? and at the current pay scales?
Until the correction also comes in the public sector job market, “caution”, I think, should be the watchword of the day. “Turning the corner” and “kicking the can down the road” you would have to at least admit are two very different concepts in need of very different assessments.
Where does the 190,000 in birth-death adjustment factor in?
Isn’t this a sizable portion of these good numbers?
Excellent post. “Jobs, jobs, jobs”, read short-term jobs NOW, sums up popular preferences rather nicely.
Interesting post. Pay attention to CBO report on govt receipts and expenses. Note the amount of individual tax receipts. VERY weak through April. I think what you will see is a continued weakness in individual tax receipts which tells the true story. Less income by taxpayers. We should have explosive tax receipts if in fact there was a major surge in jobs. It is looking anemic. Look at the continued climb in our national debt, even ignoring interagency. The only reason this year’s deficit is equal to prior years is that they have received 108B in TARP repayments. That will not continue. That means continued growth in deficits. Conclusion: waste of $1T+ in stimulus funding.
Tim Kemper,
You might want to read that CBO report more closely,
“Receipts in March and April suggest that tax revenues may soon begin to rise again. In the past two months, withheld income and payroll taxes have been greater than in the same months last year, presumably reflecting a rebound in wages and salaries and a much smaller impact from the Making Work Pay credit.”
Employment and witholding levels are rebounding together, serving as a confirmation signal. Also, ARRA expenditures are beginning to decrease slowly and will continue for the next several months. Hence, the deficits will be getting lower. Further, corporate income taxes are rebounding sharply.
http://cboblog.cbo.gov/?p=817
i feel like i’m reading congamebrowser.com. 188k birth/death model jobs, 66k census jobs, 54k gov’t jobs… wait, isn’t this already adding up to 308k jobs? where’s the job growth, where’s the beef?
to brian quinn: yes, tax withholding is slightly up due to the census additions and the continued gov’t sector growth. and you are taking a MAY as a near certainty.
“190,000 in birth-death adjustment factor in?”
“188k birth/death model jobs”
Are people still making this mistake?
baychev, a little double counting there, since census jobs are gov’t jobs, so outside of the census, gov’t jobs actually declined (probably at the S&L level). Brith/Death is an attempt to model something real, but it tends not to do well at turning points, vastly overstating jobs as the economy is turning down, and understating them when it starts to turn up. Note that the household employment numbers are turning up much more than the est survey, which suggests that B/D is not adding as many as it should at this point. I would note that 290K jobs was matched of exceeded in only 7 of the 96 months that Bush was in office. We have a long way to go, but at least we are headed in the right direction right now. Also internal indicators like the avg. workweek and number of tems point to another strong report in May. Still though we would ahve to continue at the 290k level for over 28 months (from now) to get back to having more total jobs than when the economy went into recession, and that doesn’t count pop growth.
baychev,
The birth/death number is a non-seasonally adjusted number that is added to the overall non-seasonally adjusted number prior to the seasonal adjustment. As such, the 188,000 is not a 1 for 1 addition or subtracting that you can make, nor should you make, from the seasonally adjusted headline employment data. Of course, economic troglodytes choose to ignore such things.
Dirk,
census jobs are split out of government jobs, because they are temporary and one off event.
Brian,
I see you are part of the propaganda establishment or a believer. Government transfers are at all time high, U-6 is increasing, hours worked are still 10% off their levels of 2008, wages are stagnant, jobs openings are at all time lows, but you see job growth, because the government says so. please look at the annual revisions to see where 600k jobs were shoved in last years statistics, or wait till Feb 2011 to see where these jobs will go.
“census jobs are split out of government jobs”
No, they are not. You’re double counting jobs. The census jobs are included in the 54,000 federal government jobs.
Why would you expect anyone to take your conspiracy theory nonsense seriously when you can’t even get an easily checked fact correct?
“The Household survey does a much better job of capturing the actual trend at this point of the business cycle.”
The Household survey was reporting much larger job losses than the Establishment survey in the second half of 2009. For example, the Household survey showed 589k seasonally adjusted job losses in December 2009. Non-seasonally adjusted the Household survey showed almost 1.2 million job losses in Dec 2009.
http://data.bls.gov/PDQ/servlet/SurveyOutputServlet
As of April, the Household survey shows employment at about the same level as August 2009. The Establishment survey shows employment in April about the same as August 2009 as well. So with the big downward discrepancy in the Household relative to the Establishment in Q4 2009 combined with the big upward discrepancy in the Household relative to the Establishment in Q1 2010, it looks like me like there were some sampling or seasonal adjustment issues that needed to be smoothed out over time. So I don’t give much weight to the very recently better Household numbers for that reason.
OK Steve,
things are great, it is only conspiracy therory believers like me that do not see the truth diseminated by the ministry of truth. why is that every time in an economic crisis, companies become 10-15% more productive even without any additional employee training and with no capital investment involved? all employees are raising their game a few notches rivaling the productivity gains of the industrial revolution era? really?
have you or any of your friends bragged openly that they are 10-15% more productive relative to last year?
and the retained earnings that go to offsore entities (to save on taxes, you know) are creating jobs onshore despite those marvelous productivity gains?
stop drinking this kool aid!