The 2010Q2 advance GDP release has been covered by Jim, as well as others. [RTE/Izzo] [CEA] [FreeExchange/RA] [CR] [MA] The release was accompanied by an annual revision of data extending back to data for 2007Q1. This revision alters our understanding (or lack of understanding in the cases of certain people) of the evolution of this recession. Here are the points I gleaned.
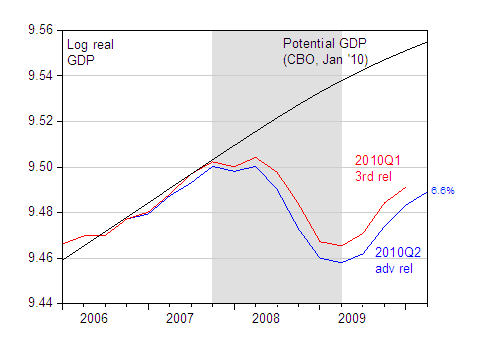
Figure 1: Log real GDP from 2010Q2 advance release (blue), from 2010Q1 3rd release (red), and potential GDP from CBO (January 2010), all Ch.2005$, SAAR. NBER defined recession shaded gray, assumes trough at 2009Q2. 6’6% is the implied output gap (in log terms) as of 2010Q2. Source: BEA, various releases, CBO, NBER, and author’s calculations.
First, it is generally unwise to make definitive statements such as Donald Luskin’s September 14, 2008 assertion that “…anyone who says we’re in a recession, or heading into one — especially the worst one since the Great Depression — is making up his own private definition of “recession.” Figure 2 below shows the impact of the data revisions on growth rates.
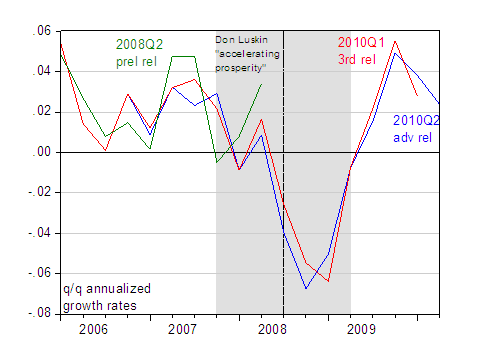
Figure 2: Quarter-on-quarter growth rates SAAR, for 2010Q2 advance release (blue), 2010Q1 3rd release (red) and 2008Q2 preliminary release (green). 2008Q2 series in Ch.2000$. NBER defined recession shaded gray, assumes trough at 2009Q2. Source: BEA, various releases, NBER, author’s calculations.
Then CEA Chair Ed Lazear’s statement “The data are pretty clear that we are not in a recession” is slightly less egregious because he was speaking on May 8, 2008, before a lot of the weak data had been reported. And implicit in his statement is the point that he was referring to the data at hand. But of course he knew the data were going to be revised … repeatedly. Anyway, you can see here previous revisions changing our understanding of the economy’s course [1] [2]
Second, this is indeed the deepest recession since the Great Depression, notwithstanding Professor Casey Mulligan’s assertions [3] [4]. Below in Figure 3 I plot the last recession against Mulligan’s conjoined 1980Q1-1980Q3 and 1981QIII-1982Q4 recessions; I’ve normalized on peak dates rather than trough dates as Professor Mulligan does, but the change is not essential to the message [5] (you can replicate the Mulligan graph using the NBER dates here).
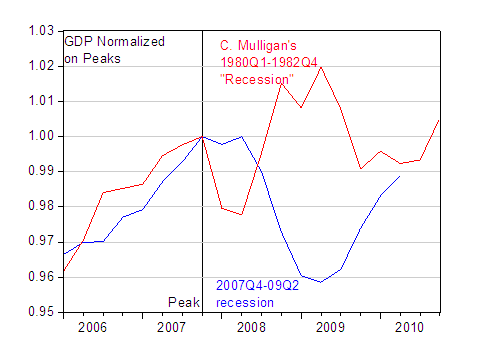
Figure 3: GDP normalized on peak dates/recession begin dates for last recession (blue) and C. Mulligan’s 1980-82 recession (red). Source: BEA, NBER, and author’s calculations.
To me, it is clear that this last recession was much, much worse than this 1980-82 “recession” Professor Mulligan alludes to. In addition, we came close to the 11 trillion (Ch.2000$) floor that he insisted we wouldn’t breach (I calculate 2009Q1 GDP when expressed in Ch.2000$ was 11.378 trillion, using a conversion factor of 0.88648, as explained in this post.) And Professor Mulligan’s October 2008 forecast was not conditioned on any stimulus package (It might have been conditioned on credit easing — not sure on this point). In any case, it is possible that a future comprehensive revision will drive the GDP figure experienced in this last recession very close to his threshold. (By the way, we long ago blew through his employment floor of 134 million, in January 2009.
Finally, the revisions provide additional information regarding the amount of slack in the economy: namely the output gap is now bigger than we were given to understand before.
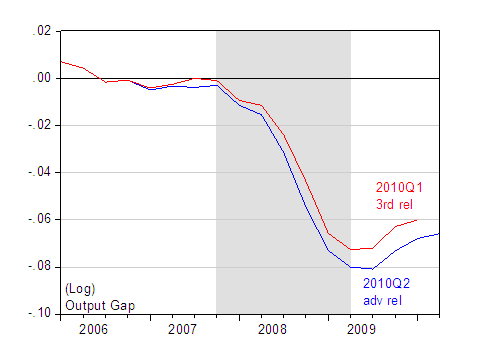
Figure 4: Log output gap from 2010Q2 advance release (blue), from 2010Q1 3rd release (red). NBER defined recession shaded gray, assumes trough at 2009Q2. Source: BEA, various releases, CBO, NBER, and author’s calculations.
In 2010Q1, the output gap was 6% (in log terms) using the pre-annual revision data. Using the post-revision data, the 2010Q1 output gap is now 6.8%, using CBO’s January 2010 estimate of potential GDP. (Presumably, CBO will revise its measure of potential GDP in light of BEA’s annual revision, but I expect the impact will still be there). Given this, it is no wonder that inflation indicators are muted. [6] As I said, we should’ve had a bigger stimulus.
My last point is directly related to the impact of revisions. Imports were a “negative contribution” to GDP growth in an accounting sense. However, higher imports are suggestive of higher economic activity, contemporaneously or in the future. In particular, one might think of capital imports as being very much related to expectations related to satisfying future demand (either domestic or foreign). In this regard, I think it’s important to observe that 46.5 bn (Ch.05$, SAAR) of the 92.5 billion increase in non-petroleum imports was attributable to capital goods imports.
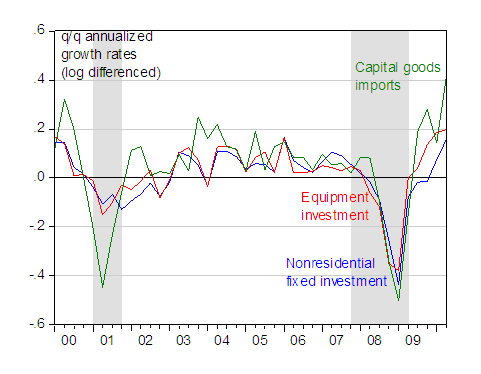
Figure 5: Quarter-on-quarter real growth rates (Ch.2005$, SAAR) for nonresidential fixed investment (blue), equipment investment (red) and capital goods imports (green), calculated as log-differences. NBER defined recessions shaded gray; assumes last recession ends 2009Q2. Source: BEA, NBER, and author’s calculations.
To the extent that investment is rebounding that’s a sign of some optimism about the future on the part of the private sector; increased capital goods imports is a reflection of that phenonenon — that’s about the only positive I saw in the report. However, even that positive is tempered by the fact that equipment investment remains 8.7% (log terms) below peak levels in 08Q1. (Nonresidential investment is 16.9% below peak.). Of course, hewing to my thesis, there’s a big caveat — the import series are based on two months worth of trade data. When the June release comes out, we may have a different take on how imports — including capital goods — have grown.
Another point, the drop in international trade was just as bad as the Great Depression. At least many of the other recessions in the past weren’t as deeply global in the way that this recession is. A “beggar thy neighbor” policy is a lot harder today.
Prof. Menzie, I understand the value of looking at the traditional data points. How about looking at less traditional ones that may be telling a different story? Like the contex index which -since the beginning of this year- has been indicating a very strong recovery of international trade (goods). It may take some time for the benefits of what this index shows to percolate into economies but the data is unmistakably positive.
Good post, Menzie.
I’d add that Fed economists and policy-makers were even worse than the private economists you quoted.
“No housing bubble,” “subprime is contained,” “no recession,” etc. With idiots like this doing the central planning, it’s no wonder the economy is such a disaster.
W.C. Varones: I’m not sure about that. I don’t know of any Fed economists who halfway through the recession said there was no chance of a there being a recession. And if there is one, well, there are at least 250 Ph.D. economists at the Board, and yet hundreds more at the Federal Reserve Banks.
I can say that no Fed economist I talked to in mid-2008 unambiguously ruled out the possibility of recession, certainly nobody as unambiguously as Mr. Luskin.
Menzie, I’m talking about earlier, as they were creating the biggest asset bubble in the history of the world and as it began to burst.
May 2005, Greenspan: Mr. Greenspan repeated many of his past reassurances about the housing market: that any bubbles were local, not national; and that people do not speculate as much on houses as they do on stocks, because they generally live in the houses they buy. […]
Mr. Greenspan acknowledged on Friday that many people were “reaching” to finance their purchases.
But he predicted that housing prices were unlikely to decline much, if at all.
“Even if there are declines in prices,” he said, “the significant run-up to date has so increased equity in homes that only those who have purchased very recently, purchased before prices actually literally go down, are going to have problems.”
March 2007, Bernanke: “At this juncture . . . the impact on the broader economy and financial markets of the problems in the subprime markets seems likely to be contained.”
W.C. Varones: The history of the Fed’s rate cuts does not support your view that in mid-2008 Fed economists believed there was no chance of a recession. In fact, the Fed started lowering rates in June 2006. In Jan 2008 the Fed twice lowered rates from 4.25% in Dec 07 (and the Dec rate was a lowering from Oct 07) to 3.50% and then again to 3.00%. So that’s 125 basis points in one month. I don’t know about you, but I wouldn’t interpret those actions as being signs of complacency at the Fed.
You would be on firmer ground if you accused macroeconomists in general of hubris in believing that most of the major intellectual battles had been fought and won. And I think this hubris led a lot of economists to put too much faith in the Fed’s ability to manage the economy. New Keynesian models were all developed around an assumption of a positive short term nominal interest rate, so there was no room for fiscal policy. Recall that during the spring of 2008 a lot of macroeconomists opposed Bush’s fiscal stimulus plan to hand out tax credits (tepid as that plan was); but that criticism wasn’t that the Bush plan was too small to be effective, it was that it was unnecessary because monetary policy could handle the problem. A quick look at the history of Fed rate cuts from Sep 07 to Apr 08 (7 cuts shaving 325 basis points) should have told macroeconomists that the Fed was in danger of running out of bullets and a fiscal plan to complement rate cuts was appropriate.
So I don’t think the problem was that economists dismissed the possibility of a recession; the problem was that too many economists put too much faith in conventional monetary operations when the nominal rate was dangerously close to the zero bound.
W.C. Varones: You point to a May 2005 statement by Greenspan to show that the Fed was unconcerned about bubbles, but you failed to point out that over the following 12 months from when Greenspan made that statement the Fed made 10 rate hikes…or just about one per month. Are you suggesting that the Fed should have had even more rate hikes? Look, there were clearly asset bubbles, but I think it had more to do with a wild west unregulated environment. Canada has a central bank and their economists read the same papers in the same journals and many were educated at American universities, but Canada didn’t have a devastating asset bubble because they had meaningful regulation.
Striking indeed was the homogeneous posting by all economies, of not a slippage but a breakdown of trades and activities in (from memory) 1q 2009.
In the 30s there was a lag between countries USA,UK were first in the economic depression, and the rest followed one year after.
Striking the general choir of official speakers denying a potential double dip.
It may be worth trading the subject of the responsibility of the economists in their forecasts,against the entrepreneurial responsibilities of the Central banks and political associates in this deepest crisis ever produced before.
Striking to see,that no resignations no culpability is recorded at any level of the planed economies command chain.
Real change of civilization is taking place.
There’s also an issue of political economy. Its a bit reductionist to say that because things were that’s the way they had to be.
There clearly was a recession ongoing from late 2008 onwards, but what turned it into a deep recession was Paulson’s political decision not to bail out Lehman’s. That lead to the banking collapse. That lead to the freeze on credit. That lead to the collapse in trade. That lead to the collapse in industrial production and so on.
It was a triumph of neo-conservative ideology over the facts.
Once the banks were bailed out then the recovery followed pretty rapidly, if not that obviously in the USA. By the spring Asia was growing again etc.
Anonymous,
They started raising rates well after it was obvious to the casual observer that they had already created the biggest asset bubble in the history of the world. Too little, too late.
Yes, regulatory failure was a huge problem, too. And the Fed is the prime Epic Failure there, too. Geithner at FRBNY was completely oblivious (or worse, corruptly complicit) as the Wall Street banks under his responsibility levered up 50-to-1, an insane amount of leverage as anyone with any common sense would see.
One of the most interesting things we see from the revisions is how deep the recession was by the third quarter of 2008. That was worsened substantially by the 2.5% negative contribution of personal consumption expenditures that was likely caused by the oil shock as well as the ongoing grind of the housing crisis.
As nearly all recession indicators were blinking fairly brightly in the summer of 2008 even prior to revision, I still find this puzzling that some feel that the recession was only a Lehman Brothers event.
Yes, the Lehman Brothers event was pivotal – because it exposed to the rest of the world how bad the siatuation was. Up until Lehmans’ event, the world continued with the illusion that gaint U.S. banks were trustworthy.
Allowing Lehmans’s to fail did not cause AIG or large U.S. banks to be in trouble. They were in trouble before the Lehman’s event.
They were all in trouble before Lehman’s but they only failed because of Paulson. If Paulson had nationalised Lehman’s or even stumped up the cash for Barclays to buy it (a meagre $5bn or so), then there would still have been a recession, but there would not have been a collapse.
It was the freeze in bank credit which caused the overnight cessation of trade and then industrial production, without the collapse, then no freeze, then no collapse. One thing follows from the other.
The preconditions for collapse only became collapse due to the Neo-Cons desire to let the market rip or as the put it at the time, to draw a line in the sand.
The tricks that history plays.
The quarter-on-quarter real growth rates in capital goods is viewed as a positive by Prof. Menzie because it may show optomism about future needs for increased production.
A different data set – Year-to-date change in nomial dollars – gives a different picture (Exhibit 8 of the July 13, 2010 Press Release).
Capital goods imports increaed by 26 billion. That is 26% of the non-petroleum import gain of 98 billion. And computers and computer accessories accounted for more than 50% of the gain in Capital Goods (automobiles are reported in another category).
These numbers suggest business as usual – buying what is needed to serve the existing market.
Of course, 5 months is less sensitive to recent changes but 5 months is likely to be a more dependable number.
The other thing to add is that the 2.8% reduction in US GDP for imports was an unambiguously positive thing for the world recovery outside the USA.
European manufacturing has continued it recovery into the third quarter, not least due to the largesse of the US consumer.
bill j and I see different things.
I think the freeze in bank credit should have happened. It was necessary because of the uncertainity as to the survivability of large U.
S. banks. Also, if AIG had also been let to go its own way, many more banks throughout the world would have failed. THEN, the culprits would have been punished, a lot of debt would have been eliminated and the world banking system would have resumed on a much better basis than the basis we had in October, 2008 when the Central Banks in the U.S. and Europe guaranteed the debts of big banks.
Yes, the reduction in U.S. GDP of 2.8% due to the trade deficit definitely helped exporters to the U.S. We are on a see-saw. Can’t help exporters to the U.S. without harming the U.S.
Those citizens of the U.S. who are concerned about the future of the U.S. economy do not willingly agree to helping others at the expense of the U.S. economy.