The recent trade release for June sparked some consternation, as it indicated 2009Q2 2010Q2 growth, conditional on data already released, would be lower. But there was also some unhappiness as it was taken by some to mark the return of the spendthrift consumer.[0] Yet, everywhere I see discussion of how consumption is lackluster, because households are deleveraging and beset by uncertainty. [1] These two narratives clash. Which one is right?
As Figure 1 shows, the 2009Q2 2010Q2 advance release and the monthly trade figures match up pretty well for goods ex.-oil. The match for total goods imports doesn’t share the same contours, due in part coverage differences and perhaps due to seasonal adjustment issues. [2]
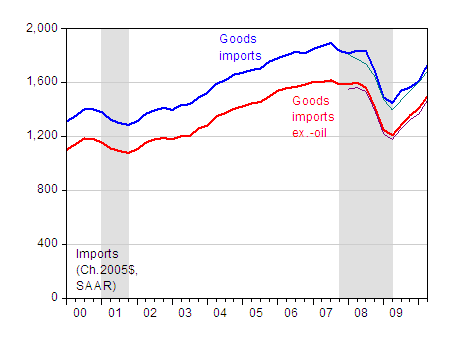
Figure 1: Real goods imports (bold blue), real goods imports ex.-oil (bold red), from NIPA, and real goods imports (teal), and real nonpetroleum goods imports (purple), from BEA/Census. All in Ch. 2005$, SAAR. NBER defined recessions shaded gray; assumes last recession ended 09Q2. Sources: BEA, 2010Q2 advance GDP release; and BEA/Census, June 2010 trade release, and NBER.
On the export side, the NIPA and trade data deviate a bit more (Figure 2), but what matters are the changes. And here the change in goods imports implicit in the 2010Q2 advance release differs from the change implied by the trade release, as shown in Figure 3. This is what is most troubling
.
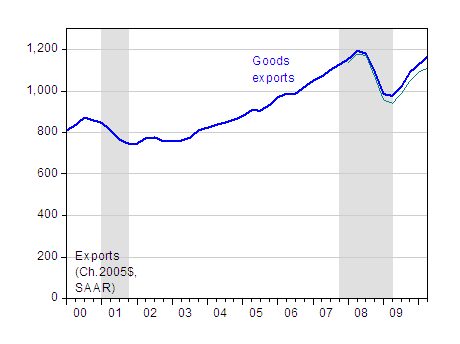
Figure 2: Real goods exports, from NIPA, and real goods exports (teal), from BEA/Census. All in Ch. 2005$, SAAR. NBER defined recessions shaded gray; assumes last recession ended 09Q2.Sources: BEA, 2010Q2 advance GDP release; and BEA/Census, June 2010 trade release, and NBER.
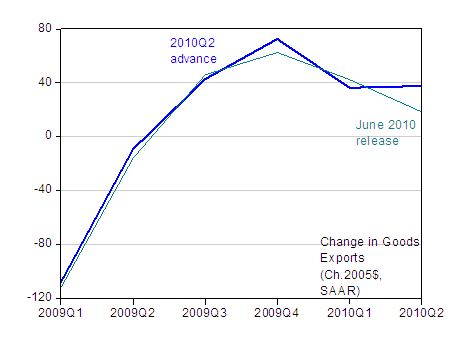
Figure 3: Change in real goods exports (bold blue), from NIPA, and change in real goods exports (teal), from BEA/Census. All in Ch. 2005$, SAAR. Sources: BEA, 2010Q2 advance GDP release; and BEA/Census, June 2010 trade release.
Now, let’s turn to the import side. Is it true that consumers are sucking in imports? Certainly, real goods imports jumped from May to June, by 155% on an annualized basis. But a single observation doesn’t make a trend, so I’ll rely on the NIPA data which seems to match pretty well the trade data. Figure 4 depicts the components of non-oil goods imports. What is clear is that consumer goods do not vary that much; now, part of auto and auto parts is going to satisfy consumer demand as well, and here we do have some evidence in support of the hypothesis of the consumer going back to his/her old ways of sucking in imports.
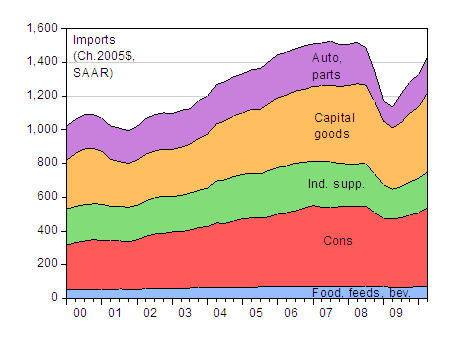
Figure 4: Real goods imports by category. All in Ch. 2005$, SAAR. Sources: BEA, 2010Q2 advance GDP release.
In order to identify clearly how much of the bounceback in non-oil goods imports are associated with each category, one can normalize on the trough, which I will place at 2009Q2. This yields the following picture.
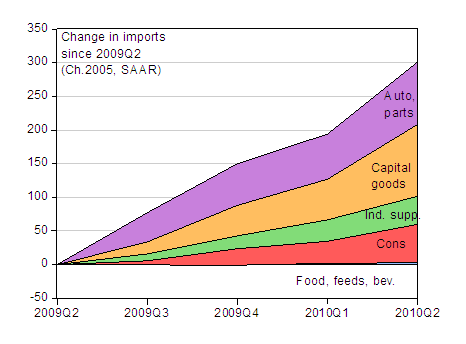
Figure 5: Real goods imports by category, relative to level since 2009Q2. All in Ch. 2005$, SAAR. Sources: BEA, 2010Q2 advance GDP release.
To me, this indicates that the story is a bit more complicated than at first glance appears. Capital goods constitute a large chunk of the import story. Now, it might be the case that these capital imports are being driven by investment to satisfy anticipated consumer demand in the future. Alternatively, the capital goods could be being imported to satisfy anticipated foreign demand.
Just to recap, here are the latest readings on personal consumption, and retail sales (the latter annualized).
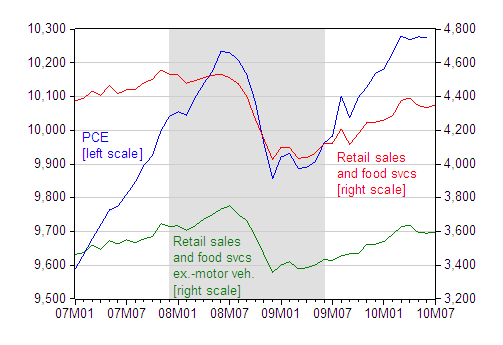
Figure 6: Nominal personal consumption expenditures, from NIPA (blue line, left axis), and retail sales and food services (red line, right axis), and retail sales and food services ex.-motor vehicles and parts. All in billions of dollars, SAAR. NBER defined recessions shaded gray; assumes last recession ended 09Q2.Sources: BEA, consumption and income release of August 3, 2010, and Census release of August 13, 2010, and NBER.
Consumption hardly seems resurgent, so attributing the increase in imports to consumers means that one is assuming a very high share of imports to incremental consumption — something I’m not sure makes sense. So, I think the book is still open on whether the consumer is going to drive the US back into a rapidly expanding trade deficit.
2009Q2? Um….I think you mean…
Another possible explanation for the rapid rise in capital goods imports is that replacement of equipment lagged during the recession, and firms are simply tidying up. That would still be in anticipation of rising demand either at home or abroad, but not necessarily rising as strongly as capital spending. My understanding is that industrial capacity fell during the recession, something that doesn’t happen in most recessions.
The trade deficit will be much more driven by oil prices, the federal budget deficit, and FX movements than by consumers going deeper in debt.
The consumer has hit a wall in his ability and willingness to take on more debt, yet seems unlikely to take on significant lifestyle reductions unless absolutely forced to. Movements in consumer debt levels will be slow.
Imports and exports in the BOP,trended more tightly since 2004.
Exports of Goods and Services, Balance of Payments Basis
http://research.stlouisfed.org/fred2/series/BOPTEXP?rid=51&soid=18
Imports of Goods and Services: Balance of Payments Basis
http://research.stlouisfed.org/fred2/series/BOPTIMP
kharris: Thanks, have fixed the typos.
The surge in capital goods imports could be driven by the large amount of deferred investment associated with an extraordinarily long recession.
Another way to guage why the trade balance is again worsening is to examine what is going on with capital flows, since the worsening of the current acount balance must be matched by an increase in net capital inflows. Was there an increase in private foreign investment in the U.S., a fall in U.S. investments abroad, or an increase in official capital inflows (increased dollar purchases by foreign central banks)?
“The surge in capital goods imports could be driven by the large amount of deferred investment associated with an extraordinarily long recession.”
What happened to the ratio (imports)/(competing domestic output) for this category (and the others as well)? For example, suppose consumer goods accounted for all of the increase in imports. What would this tell us about the cause of the trade deficit? After all, this could happen even if the consumer were not coming back at all, as a result of a shift towards imports and away from domestic output (as you allude to in your penultimate sentence.)
Why are we importing capital goods anyhow. Is this Germany getting a free ride?
Steve Bannister:
We stopped making capital goods when we figured out that everybody could get rich by sucking out home equity, flipping real estate, and being mortgage brokers and realtors.
Steve, I think you will find that Asian countries are the ones experiencing the largest benefit for capital exports. China, Japan, ROK.
W. C. Cojones and others might find it useful to spend a little time with a copy of Ricardo. Perhaps he is no longer covered in Econ 101? Maybe Professor Chinn could comment?
C Thomson,
I don’t deny that we have a Ricardian advantage in producing debt, derivatives, and accounting fraud.
What I question is the value of that advantage.
C Thomson,
I don’t deny that we have a Ricardian advantage in producing debt, derivatives, and accounting fraud.
What I question is the value of that advantage.
Have we not slipped back into recession? My impression is that we did in late June.
Calculated Risk is showing a huge upcoming miss in July home sales. This is consistent with what we’re seeing in Princeton, where we seem to have a massive housing overhang; and rental prices seem to have fallen off a cliff in late June.
And initial jobless claims over 500k nationaly.
And Philly Fed Index shows first contraction since July 2009.
I don’t know, but it seems to me we’ve slipped back under water.
ECRI leading indicators have been pointing down too for the last couple months.
But saving money is like holding your breath. Nobody can do it for long without coming up for air once and awhile. There is probably a chinese proverb for it. Until I can remember it, I think economists call it “bouncing along the bottom”.
Besides, many people expected this. The stimulus ended and wouldn’t be sustained growth. The housing tax credit and Cash for Cars ran out and pulled demand from the future. And the consumer may have had a epiphany…the house really isn’t a third wage earner in the family!
CThompson – There is much more in play with international trade right now than comparative advantage. With a sufficiently undervalued currency, a country can have an absolute adantage in everything. Asia has amassed well over $5 trillion in official foreign reserves, the bulk of it since 2000, trying to keep local currencies unervalued. Total foreign official holdings of U.S. assets are roughly $4.6 trillion, of which Asia accounts for about $3.5 trillion. Most of this was built up after the dotcom bust in 2000.
Krugman has called for action against these policies, but BO and Timmy are disinclined to action. (Actually, I have to believe it is Summers – he is the intellectual power in the White House. Timmy isn’t even a trained economist.)
How Treasury can get away saying that China is not a currency manipulator seems incredible to me. Certainly, some U.S. multinational corporations gain from arbitraging the price differences (e.g., Nike and Apple paying low wages in China and selling at U.S. market prices.) They may be willing to sell out U.S. workers for their own profit, and political leverage being what it is, it is not inconceivable that such investors would have clout beyond that of much bigger economic interests.
Every time the debate comes up on this issue, I see comments like the following, which are becoming tiring.
“You’re being protectionist. Don’t you know any history? Look what happened with Smoot-Hawley”
“Stopping China from keeping the yuan (renminbi) undervalued won’t help the U.S trade balance. It is U.S. borrowing that drives the trade deficit.”(Even Stiglitz made this argument.)
I thought after Krugman addressed these points(for example, pointing out that Stiglitz was making the same error as others who apparently believe in the doctrine of “immaculate tranfser”-should have been very embarassing for Joe), I wouldn’t see them come up so often anymore, but ignorance has proven to be very, very stubborn.
Don,
I still have doubts about us turning into USA Inc. at this point. I think USA, Inc. would resemble an LBO company much more than resemble Japan, Inc. of the ’80s.
But China just took some steps to internationalize Chinese bond trading which automatically decreases their ability to peg at will. They may have decided the time is near to let the RMB float more freely.
Of course then maybe we do get the long awaited sell off in treasuries and the buck. But I don’t think we’ll be popping the champagne corks and celebrating victory in that case either. But at least we will be spending much more money on gas than we spend at Walmart.
Professor Chinn looks at different sets of data, which is good. Another data set is Exhibit 8 of the June 2010 release which shows change in International Trade in Goods and Services in current dollars from June 2009 to June 2010.
Industrial supplies is a much bigger component of the change, accounting for 40%. If we assume that Computers and Computer Accessories (from the Capital Goods category) is sold mostly to consumers, we can add that number (17.8 Billion) to Auto Dales and Consumer goods and get a maximium of 43% of the total change in imports allocated to consumers.
I have no explanation for the difference between the share of industrial supplies shown in these data and the last chart provided by Chinn (shown in 2005 dollars).
My conclusion is that these trade data support the view that manufacturing is at long last making a comback in the U.S.
My numbers above did not agree with those provided by Professor Chinn because I did not remove oil from the Industrial Supplies.
Corrected calculations show my grouping of consumer goods at 60% of the gain; 38% going to production.
Leads to a different conclusion. Computers and Computers Accessories are difficult to classify. If they were split 50% between consumers and business purchases the revised numbers would show 54% of the gain in the consumer category.
Now say both consumer purchases and manufacturing are growing. Manufacturing continues to be of interest because it is the foundation of solid growth in employment and production in the U.S.
OT,
The internets are ablaze this weekend with former Fed governor Frederic Mishkin soiling himself.
What exactly is the mechanism by which a “sell off” of U.S. treasuries would happen? Who would do so, and why? Would there not be profound negative ramifications for even attempting to do so? Would there not be factors limiting the ability of such a sell off to even take place? Over what timeframe are people envisioning such a sell off?
For the better part of a decade I keep hearing and reading the same “sell off” phrase, or some variant of it, none of which ever offer any details beyond mentioning China, which holds a bit less than 7% of those treasuries.
Half the gain in capital goods is from computers, much use of which will be recreational.
I would like to see a graph split into two halves. Cars and oil vs. everything else. Just to see how much high usage of cars is costing us.