…According to the CBO
In evaluating the advisability of extending either completely or partially the tax cuts of 2001 and 2003 (aka EGTRRA and JGTRRA), and implementing additional fixes to the AMT, one should consider the impact on the budget.
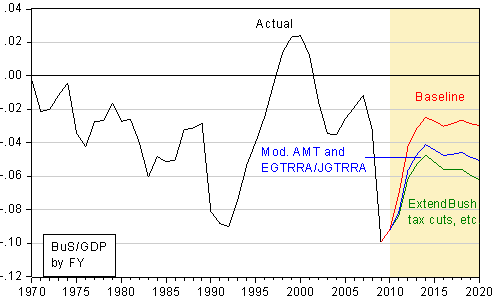
True fiscal hawks, for instance, should be interested in the gap between the CBO baseline (red) and the extending EGTRRA and JGTRRA and index the AMT for inflation (green line).

Figure 1: Deficit as a share of GDP, actual (black), under CBO baseline (red), under President’s tax proposals for EGTRRA/JGTRRA and modification of AMT (blue) and extension of EGTRRA and JGTRRA and indexing AMT for inflation (green), by fiscal years. Shaded area is projected. Source: CBO, Budget and Economic Outlook: An Update (August 2010); CBO, An Analysis of the President’s Budgetary Proposals for Fiscal Year 2011 (March 2010), CBO Historical Statistics, and author’s calculations.
According to the just released CBO, Budget and Economic Outlook: An Update [link], the impact on revenues of extending the EGTRRA/JGTRRA provisions is $2,652 billion, over the FY2011-2020 period; the increased debt service is estimated at $660 billion. If the EGTRRA/JGTRRA were extended, and the AMT indexed for inflation, then the impact on revenues would be $3,893 billion, with associated debt service of $947 billion.
According to the March 2010 CBO assessment of the President’s budget [link], the impact on revenues from the partial extension of EGTRRA/JGTRRA is $2,154 billion over the FY2011-20 period, and from indexing the AMT $577 billion (Table 1-3). The CBO doesn’t break out debt service associated with each of these measures, so I pro-rated the additional interest associated with the President’s proposal (as scored by CBO). This implies a cumulative interest cost of around $485 billion.
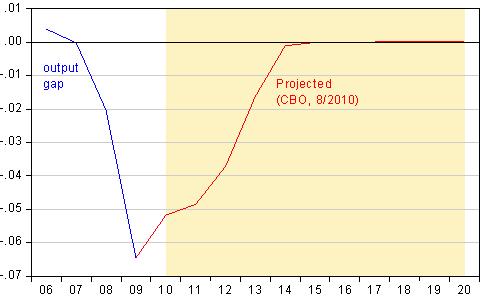
The graph highlights the fact that these extensions hit particularly hard in the out years, when output has presumably come near potential; that is, in the out years, we would be running a structural budget deficit. This reinforces my view that it is foolhardy to focus on fiscal retrenchment now, when slack is at very high levels.

Figure 2: Output gap, expressed as a share of potential GDP. Shaded area is projected. Source: CBO, Budget and Economic Outlook: An Update (August 2010), and author’s calculations.
For an assessment of the differential impacts of full extension versus extension only for household dual incomes less than $250K (as in the President’s proposal) versus allowing expiration of EGTRRA and JGTRRA as they were originally legislated, see this post.
Post re-created from original post on Monday, 9/6.
Menzie, minor type here: “then the impact on revenues would be $3.893 billion, with associated debt service of $947 billion.”
CoRev: Thanks — fixed now.
Menzie, let’s start with the baseline in Fig 1. Did the %GDP actually change direction in 09? I charted it here: http://tinyurl.com/y2bnnyz . It show it continuing up.
That little issue brings the validity of the baseline into question, which for a skeptic (who dat?) brings the validity of the sources into question. But, more importantly, then brings the precision of the chart into question.
You appear careful not to imply a recommendation, but I wonder if the discussion gets heated whether the analysis will hold up.
CoRev The data in your chart is out of date. According to the notes the 2010 deficit and GDP are estimated values from the FY2011 Budget submission, which was quite awhile ago. According to CBO’s latest revised data:
“The Congressional Budget Office (CBO) estimates that the federal budget deficit for 2010 will exceed $1.3 trillion—$71 billion below last year’s total and $27 billion lower than the amount that CBO projected in March 2010, when it issued its previous estimate. Relative to the size of the economy, this year’s deficit is expected to be the second largest shortfall in the past 65 years: At 9.1 percent of gross domestic product (GDP), it is exceeded only by last year’s deficit of 9.9 percent of GDP. As was the case last year, this year’s deficit is attributable in large part to a combination of weak revenues and elevated spending associated with the economic downturn and the policies implemented in response to it.”
So yes, there was a turning point.
It is wrong to pro-rate the cost of debt service. The MA forecast estimates no difference in federal interest rates between partial and full extension. So according to the MA forecast, full extension will reduce receipts, but will not increase the cost of servicing all existing debt or the additional amount from partial extension. Not projected is that the reduction in GDP will reduce state and local tax receipts, increasing debt service costs of governments that the we are already bailing out. Also, increasing tax rates on interest income will increase the interest cost of private debt. Increasing tax costs and decreasing GDP will further increase the cost of servicing all present and future private debt.
Stimulating government and private consumption will increase interest rates and the cost of debt service. Cutting taxes on savings and investment will increase savings and investment and reduce the cost of capital and debt service, even if it increases the federal deficit.
BTW, I’m not thrilled that the deficit as a percent of GDP fell in 2010. I would have liked to have seen something closer to 11 percent rather than 9.1 percent. I see the apparent turning point as a bad news story that will make long run deficit reduction very hard to deliver.
CoRev: I think 2slugbaits has addressed your question. I’m using the latest available CBO scoring. Other scorings will differ.
TDM: In this article am sticking with the CBO approach of not dynamic scoring. For a discussion of why I (and for official forecasts, the CBO) stick with this approach, see: [1] [2].
I don’t disagree in principle with the idea that decreasing a tax rate might increase revenues slightly relative to the static impact, due to higher resulting income, but in order retain comparability of these projections with the other CBO projections, this is what I’ve done here.
2slugs, thanks. I stand corrected.
While the CBO doesn’t do dynamic scoring for the future, the CBO does analyze the past if asked, so…
Has the CBO answered some version of this question:
How many more jobs did the 2001/2003 tax cuts create relative to the 2001 projections?
Compared to prior decades peppered with smaller tax hikes, or a few initial massive tax hikes, the 00s substantially under performed the 80s (peppered with tax hikes) and the 90s (two massive tax hikes that cost politicians their jobs for hiking taxes).
menzie: Is this the same CBO that said transfer payments have a 1.5 multi[lirt effect? Not really credible.