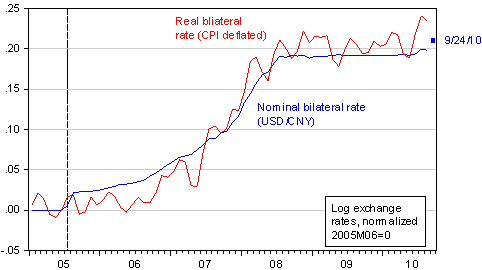
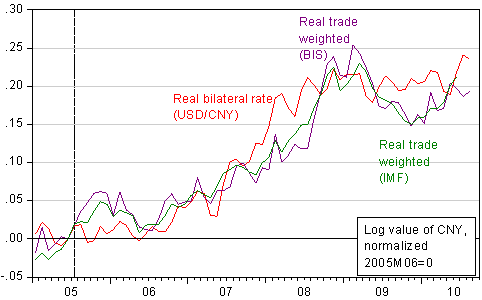
Since China’s currency is in the news [NYT], [Reuters] [Economix/Leonhardt], I thought it useful to update and extend the data depictions from the post a week ago.
The main points I hope to convey from these two graphs are:
- The nominal and real exchange rates can diverge substantially in theory and in practice. Recently, the US-China real bilateral exchange rate has diverged from the nominal due to faster inflation in China.
- The bilateral exchange rate can diverge from the trade weighted exchange rate. In open economy macroeconomics, we usually concern ourselves more with the effective (in this case trade-weighted) exchange rate.

Figure 1: Log nominal bilateral USD/CNY exchange rate, monthly average of daily values (blue), and daily noon value for 9/24 (blue box), and log real bilateral USD/CNY, deflated using CPI (red). Both series defined as “up” denotes appreciation of CNY, both normalized to 2005M06=0. Dashed line at de-pegging in July 2005. Source: St. Louis Fed FREDII, CEIC, IMF, ADB Asia Regional Integration Center, and author’s calculations.

Figure 2: Log real bilateral USD/CNY, deflated using CPI (red), log real trade-weighted value of CNY from BIS (purple), and log real trade-weighted value of CNY from IMF (green). All series defined as “up” denotes appreciation. Dashed line at de-pegging in July 2005. Source: BIS, IMF International Financial Statistics, CEIC, St. Louis Fed FREDII, ADB Asia Regional Integration Center, and author’s calculations.
Since the graphs are expressed in log terms, normalized to 2005M06 (the month before China moved away from its peg), the the numerical value on the left axis can be read as the percentage appreciation in the yuan that has taken place since mid-2005 (in log terms, of course). The yuan is now therefore about 21% (24%) stronger against the dollar in nominal terms, and 20% stronger in trade weighted real terms as of August, as compared to June 2005.
Next post: Some updates on Chinese trade elasticities. (Earlier estimates discussed here and here.)
Ronald McKinnon has a letter to the editor in the WSJ today (Friday) about this topic as well.
I though McKinnon made a good point. He noted that wage inflation in China is 20% to 30%, (and if allowed to continue, would theoretically equalize with U.S. wage rates in the long run.)
He went on to point out that if Chinese exporters believe the yuan is going to depreciate, then they will not be so eager to increase wages so that the wage advantage the Chinese enjoy will persist.
It seems to me that either export price inflation or yuan depreciation would have the same impact on the level of trade and wage inflation.
China still centrally manages much of the economy. Can such a beast be managed? My hunch is that the distortions will ultimately create a Chinese bust.
So…just to make sure I didn’t get confused flip flopping thru all the mathamatiks and international economiks condensed into graphical form here, can we conlude then that the real bilateral exchange rate rising in 2010 means that chinese companies have been able to get dollar denominated price increases, even tho the chinese government hasn’t changed the peg?
Waiting for wage inflation in China to bring PPP is like waiting for Godot. There ia a large pool of unemployed to be soaked up before the policy of using currency manipulation to gain competitive advantage is offset by domestic price adjustments. The same would be true of trade gains caused by Ben’s current policies, which I regard as short-sighted owing to the fragility of the trade partners that will suffer the corresponding trade losses.
McKinnon’s comments on this should be weighed against Krugman’s in proportion to their respective vitas.
I say again that looking to the exchange rate is not the most informative way to gauge China’s currency policies. The best way is to look at capital flows, and in particular, official capital flows. Why not a post on this topic? The issue then is to determine the effect of the official capital flows on net private capital flows. The official flows minus this effect gives the artificially-created component of China’s trade surplus. Assuming (reasonably, I think) that reaction functions are not perverse, this must always be positive, the question is just a matter of degree. There is simply no excuse for such actions, a point that apologies such as McKinnon’s fail to acknowledge.
Menzie
Just a nitpicky comment on the charts. The top chart shows nominal bilateral in blue and real bilateral in red. The bottom chart shows real bilateral in blue. As any good Powerpoint Ranger will tell you, it’s best to try and be consistent in the colors across charts; i.e., real nominal bilateral should be either red in both charts or blue in both charts. That’s all.
Don points out that in China:
There is a large pool of unemployed to be soaked up before the policy of using currency manipulation to gain competitive advantage is offset by domestic price adjustments.
Meanwhile, and further complicating things, their low-end jobs are going to illegal immigrants!?!
http://modeledbehavior.com/2010/09/22/illegal-immigration-is-global/
Cedric
Whilst not going covering all the components of trade,one of them the silk products may illustrate the dollar denominated price increase.
The price of white silk (type A) has soared to 300,000 yuan a ton from 170,000 yuan last year.
Vertical integration coupled with quasi monopolistic production may not be translated right away through EXR in the trade balance even when hurting domestic producers.
2slugbaits: Point well taken. Figure 2 colors changed.
don: Don’t know about wage inflation, but the Chinese CPI is rising at nearly 20% (annualized) over the last three months ending August.
Menzie,
Do you foresee a looming problem for China or can they grow their way out of any significant problems?
Here are some (most anecdotal) issues –
An analyst on CNBC claimed that construction is 60% of Chinese GDP and that China has recently been building capacity in spite of apparent excess capacity. ( I think he was referring to commercial real estate, with new buildings being built beside empty ones.)
If that’s true, then it would seem future Chinese growth is going to be difficult to sustain.
Couple that with 20% cpi inflation, and 20%+ wage inflation.
Add to that the lack of Chinese transparency that helped create the ‘Asian Contagion”, and it seems many of the ingredients are in place for a Chinese bust.
Any thoughts on Chinese growth?
Menzie, thanks, but where did you get your figures? Or are you merely saying that inflation in China has grown 20% over its previous rate? But that is misleading – going from 1% to 2% would be 100% increase in inflation. And you copuold say it has grown infinitely since 2009 (when they had deflation). The CPI inflation you refer to appears to have come from floods and hot weather hitting food production.
http://www.tradingeconomics.com/Economics/Inflation-CPI.aspx?Symbol=CNY
“China’s consumer prices rose at the fastest pace in nearly two years in August, as severe floods and unusually hot weather destroyed crops, driving up food prices.
China’s consumer price index rose 3.5% on year in August, compared with 3.3% in July, the statistics bureau said. The figure marked the 10th straight month the inflation has risen.”
According to the site, China experienced deflation in 2009.
don: I have older CPI level data from CEIC. I updated using the ADB ARIC y/y change data. The number cited is 3 month annualized, viz., [(P[t]/P[t-3])^4 – 1 ]; what you are quoting is y/y inflation.
So, am I correct that with annual inflation of 3.5%, even if it is increasing at a rate of 20% per year (for example, from 3.5% to 3.5*1.2 per year in the first year), and even if U.S. inflation stays at less than 1% (or goes slightly negative) it would take a number of years for the currencies to come to PPP, at least according to the usual assessment of yuan under valuation? But recall Chin had deflation in 2009. If I’m right, we are going down again and I would not be surprised to see Chinese inflation falling below ours.
That said, I have been reassessing the effect of the massive misallocation of investment in China. The only excuse I can see for not forcing China to revalue the yuan is that it may result in some rather dramatic adjustments in investment that may do very great damage even to their growing economy.
don: Depends on the degree of misalignment; using the PPP-relative income relationship as in Cheung et al. (2010), rapid inflation might have already pushed above equilibrium (absolute PPP doesn’t hold).
“rapid inflation might have already pushed above equilibrium”
Seems to me belied by the massive currency interventions.
don: That’s why I said by “the PPP-relative income relationship”. On numerous occasions, I have stressed that there are multiple definitions of equilibrium exchange rates (do a search on Econbrowser to see for yourself). You mentioned PPP, which I myself do not find a particularly useful definition of equilibrium exchange rate for policy purposes.
China has bought more than $650 billion in foreign reserves from January 2009 to June 2010 to keep the value of the yuan from rising. That makes me doubt about any measure that shows the yuan to be at or above its equilibrium value.