The U.S. economy managed to keep growing in the third quarter, but well below what’s needed for a normal economic recovery.
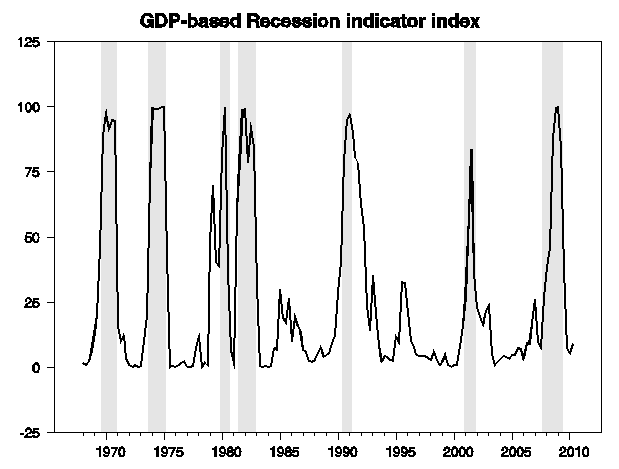
The Bureau of Economic Analysis reported today that U.S. real GDP grew at an annual rate of 2.0% during the third quarter. The latest GDP numbers bring our Econbrowser Recession Indicator Index for 2010:Q2 up to 9.1%. We would not declare that a new recession has begun until it gets back above 67%.

|
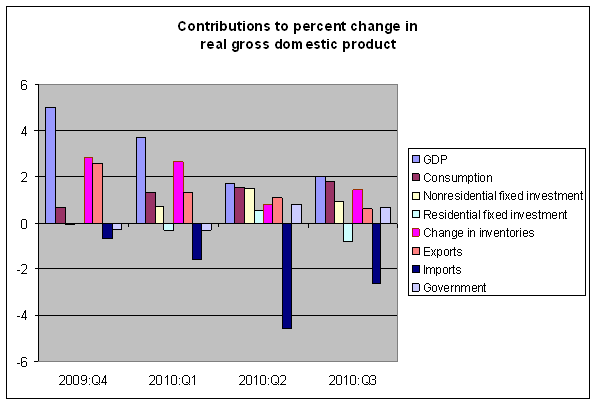
Inventory rebuilding often contributes to above-average growth in the initial phases of a recovery, and continued to do its part in the third quarter as well, with inventory gains contributing 1.4 percentage points to the third-quarter growth. But that means that real final sales were only up an anemic 0.6% (annual rate) for Q3, the kind of number you might expect in a recession rather than the early stage of an economic recovery.

New housing construction, another factor that typically would be contributing to above-average growth at this phase of the cycle, subtracted 0.8 percentage points from the growth total, almost wiping out the decent positive contribution from nonresidential fixed investment. And the respectable gains in consumption and exports were canceled out by an equivalent growth in imports.
We usually expect above-average growth at this point in the cycle, and we need above-average growth to make any progress in bringing the unemployment rate down.
But so far, we’re not getting it.
GDP prices increased faster in the 3rd qtr than real output (2.3 to 2.0). A bad omen.
Look for the third quarter figure to be revised upward a bit in the months ahead. Today’s real GDP figure of $13,261 billion (in chained 2005 U.S. dollars) is a bit below what we had projected would be the final estimate for 2010Q3 back on 5 October (we had $13,284 billion as the target.)
If today’s number holds, look for the real GDP growth rate in 2010Q4 to be below 2% – the economy is slowing down.
As you note, housing is a drag now, not a lift. In fact, growth in nearly all the interest-rate sensitive sectors is slowing, or gone. Non-residential construction is the only such category that has improved, turning to a slight positive, but this component is typically a mid-expansion leader, not early-expansion. With leading, rate-sensitive sectors cooling off and a middle-expansion sector growing, it looks like the best days for growth in this expansion are already behind us. Oh, Joy!
The cooling in rate-sensitive sectors may also mean that the Fed doesn’t have much hope of helping the economy appreciably with more accommodation. Easy money has to interact with something in order to have an effect, and the stuff it would interact with in other cycles seems mostly used up.
Calculated Risk notes the Inventory component (in a more cursory fashion):
“Inventory rebuilding often contributes to above-average growth in the initial phases of a recovery, and continued to do its part in the third quarter as well, with inventory gains contributing 1.4 percentage points to the third-quarter growth. But that means that real final sales were only up an anemic 0.6% (annual rate) for Q3, the kind of number you might expect in a recession rather than the early stage of an economic recovery.”
And that sends me back to your bar graphs to see how the impact of Inventories over the past year: generally falling GDP #s with accompanying falling inventory #s; falling exports and generally increasing imports; and not so obvious Investment #s.
How rare is it for Residential investment to have sub-zero impact on GDP over a year? Is this the little bar graph that should be contributing, say 1/3 of the GDP final?
Is the last trade deficit number in yet?
Real gross domestic purchases is an important proxy statistic for aggregate demand. The advance Q3 report shows that the year-over-year rate of change in real gross domestic purchases was 4.0%. This represents the highest growth rate (y-o-y) since 2004. The nominal number was a 5.3% increase. in Q2 the increase was 3.8% (real). Growth in aggregate demand looks almost “robust”. The problem is that a lot of this demand is “leaking” into imports. This is evident in the -2.0% contribution from net exports in Q3 GDP number. The trade imbalance is the big issue here; more so than any other factor. It is the “wedge” that separates U.S. purchases from U.S. production. It is not clear to me how either more fiscal stimulus or more Fed QE will impact where aggregate demand goes (here or overseas). It appears that domestic consumer and business spending is healthy, once you exclude the impact of the trade deficit.
In the second quarter GDP growth number was estimated at 2.4% and subsequently revised down to 1.7%. Downward revision of the initial estimate of GDP seems to be a pattern. Why is the assumption that the estimate is correct this time round? What is the impact if the number will be revised downward?
Your statement is provably false, as we see from this chart and also this chart.
In fact, what’s been happening ever since the 1970s is that America has been increasing productivity by shipping jobs overseas. First manufacturing jobs got shipped overseas, now, more recently, high-wage high-skill “knowledge work” are getting offshored en masse, courtesy of software and computer programs and the internet. As a result, in each recession since the early 1990s, employment growth has fallen in the aftermath of the recession. The reason is obvious: in every recession since the 1980s, employers have taken the opportunity to permanently offshore the jobs lost because of laid-off American workers. Thus, in each recession since the 1980s, the American workforce has lost progressively more jobs, and consequently post-recession employment bouncebacks have gotten weaker and weaker.
Source: “The Big Squeeze,” Newsweek International Edition, 30 May 2010.
This article sums up the 30-year-long process of destroying the American economy:
Source: “The only things that matter…and no one talks about.”
mclaren,
That article has a serious flaw. This part is short on understanding: “We also outsourced our wealth to Asia, OPEC, and Wall Street”.
To begin with much of what we spend in Asia, and on oil, is recycled back to us. When China for example buys our T-bills they are lending us money back at low enough interest-rates so that we may use it as we may. This allows the US to cut taxes while conducting 2 wars. The tax cuts in turn allow for increased capital formation which allows the US an advantage in gaining global market-share as well having ample capital for domestic investment (boo-koo securitizations). This capital formation though is made possible because the US Government is being subsidized by nations which must use surplus dollars to purchase T-bills to keep their currencies from appreciating. ‘They’ call it dollar hegemony, ‘we’ call it protecting our ‘national interest’.
Of course China has been using its dollar surplus to buy things other than T-bills. Then ‘we’ call it ‘currency manipulation’. Back in the ’70s when nations tried to spend their dollars ‘errantly’ ‘we’ called it an “act of war” and ‘they’ went back to lending us ‘our’ money, I mean ‘their’ money, back again. But those were little nations and China is of course not so little.
What is really great about reserve currency status though is that if we get too deep in debt, say for example if our government falls asleep on the job so to speak, and our rating agencies begin to specialize in conflicts of interest, and our financiers become frenzied with greed due to the irresistible temptation of it all, chance of a lifetime fleecing conditions extraordinaire, well, then after the crash when the accumulated debt seems almost crushing, a reserve currency nation has the option of devaluing its currency and transferring some of that debt to foreigners. In fact, the very currency manipulating little buggers who think they can use our dollars, I mean their dollars, to but other stuff with, in mass, are the very same people who stand to lose the most as the dollar falls. That we should be forced to manipulate our currency with QE so as to punish them for currency manipulation is a bit embarrassing after accusing them of the same trick, but what is a reserve currency nation expected to do? Take responsibility for the mess that it created?
Anyway, whoever wrote the piece that you provided a link to has no idea of what is really happening. The US has been trading paper of dubious value for things of actual value since 1971. Think of it this way, if you were a farmer, and the only person you dealt with was a banker who paid you for your goods with promissory notes, which eventually lost value because you had no use for them other than lending them back to the banker for a pittance, how long would you continue to trade with the banker? How would you like his solution of simply devaluing the notes after he had agreed to buy your goods at a higher price in the past? Retro-discounting is the opposite of “outsourcing wealth”.
McClaren: Here are some other items you might find of interest: [1], [2].
Gentlemen,
0.6-0.7% real final sales trend is roughly what is implied by real money supply growth ex incremental gov’t spending; the likely trend rate of post-’00 real GDP through the rest of the decade; and the secular long-term trend of labor force and population growth beginning in the mid- to late ’10s.
As in Japan since the late ’90s, M2 will likely not exceed an avg. 2-3% annualized in the decade ahead, including the the incremental effects of gov’t borrowing and spending and the net liquidation effects of tens of millions of Boomers selling stocks and corporate bonds.
M1 could continue growing at 7-10%/yr., which will be primarily a function of the growth of the monetary base and gov’t borrowing and spending.