And Implications for US Exports
Nearly two years ago, I noted the collapse in world trade, and observed that various explanations for the decline ranged from the drying up of trade financing, to amplification due to vertical specialization, to the composition effect (the fact that durables are over-represented in trade relative to GDP).
The Fall and Rise of World Trade
I followed up in several posts [1] [2]. This post reviewed the VoxEU survey which assessed the various explanations. Over time, the evidence has accumulated that the composition thesis explains the bulk of the downturn. From the abstract from a paper by Jonathan Eaton, Sam Kortum, Brent Neiman, and John Romalis, entitled Trade and the Global Recession:
The ratio of global trade to GDP declined by nearly 30 percent during the global recession of 2008-
2009. This large drop in international trade has generated significant attention and concern. Did the
decline simply reflect the severity of the recession for traded goods industries? Or alternatively, did
international trade shrink due to factors unique to cross border transactions? This paper merges an
input-output framework with a gravity trade model and solves numerically several general equilibrium
counterfactual scenarios which quantify the relative importance for the decline in trade of the changing
composition of global GDP and changes in trade frictions. Our results suggest that the relative decline in
demand for manufactures was the most important driver of the decline in manufacturing trade. Changes
in demand for durable manufactures alone accounted for 65 percent of the cross-country variation in
changes in manufacturing trade/GDP. The decline in total manufacturing demand (durables and non-
durables) accounted for more than 80 percent of the global decline in trade/GDP. Trade frictions
increased and played an important role in reducing trade in some countries, notably China and Japan,
but decreased or remained relatively flat in others. Globally, the impact of these changes in trade
frictions largely cancel each other out.
The authors take simulate the effects of four types of shocks: (i)
demand shocks (or more precisely, shocks to a sector’s share in final demand), (ii) deficit shocks, (iii) productivity shocks, and (iv) trade-friction shocks. The results are shown below:
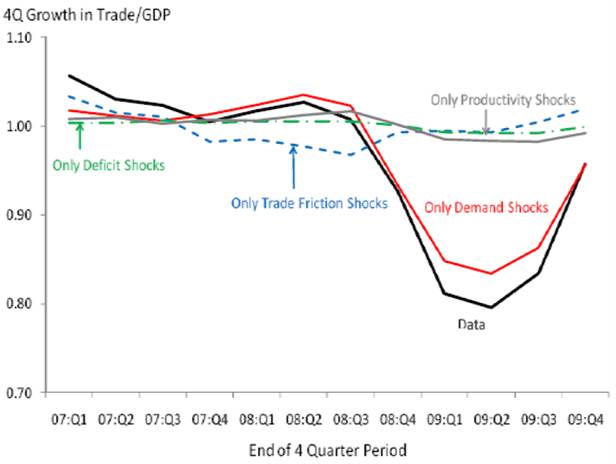
Figure 14 from Eaton, Kortum, Neiman and Romalis (2010).
The finding of a small role for trade costs is at variance with the findings by Jacks, Meissner, and Novy (2009). I don’t have an explanation for the difference in the results.
While the evolution of overall world trade over the 2006-09 period is well explained by demand shocks, this is not necessarily true for all countries. The authors note:
Heterogeneity in the Head-Ries indices found earlier, suggest that trade friction shocks may
be more successful in explaining the experiences of some countries. In Figure 15, we examine the
profiles for some large countries that display different qualitative patterns. The United States and
Germany largely mirror the World, with the set of pure demand shocks explaining most changes
in trade to GDP. For Japan, the actual declines are larger in the depths of the recession, and no
single shock type can on its own account for the majority of these declines. In China, the decline
started earlier and, like Japan, no single shock type captures it. For both Japan and China, the
trade friction shocks are arguably the largest factors.
I found this result quite interesting, and I discovered that, in contrast to the strong correlation exhibited by the US, the relationship between GDP and imports is attenuated in China and Japan.
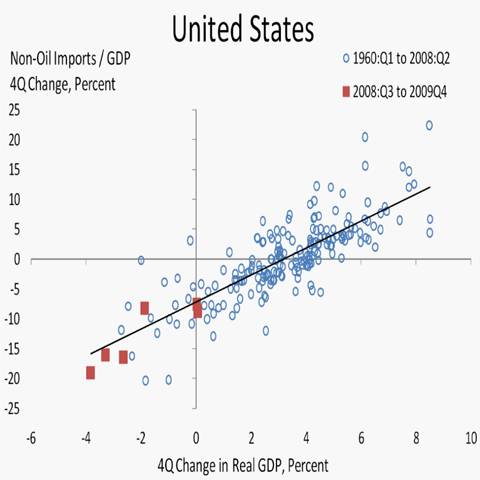
Figure 2 from Eaton, Kortum, Neiman and Romalis (2010).
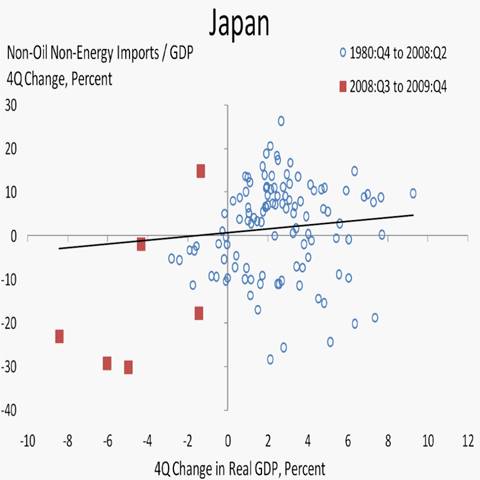
Figure 2 from Eaton, Kortum, Neiman and Romalis (2010).
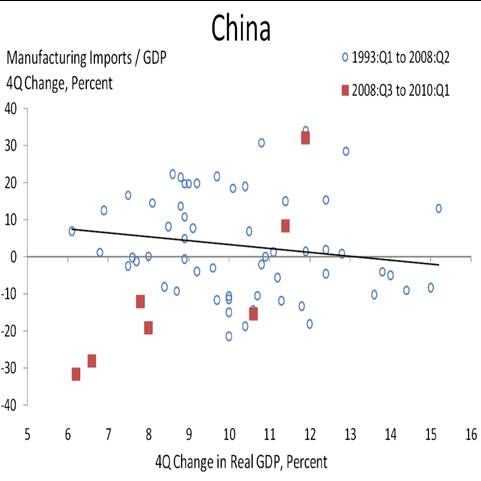
Figure 3 from Eaton, Kortum, Neiman and Romalis (2010).
The deviation from the regression line is particularly pronounced for Japan and China. For these two countries, alternative explanations are more plausible, including trade frictions and vertical specialization.
A final observation. As the extent of the trade downturn became apparent, the OECD countries made a concerted effort to provide additional trade financing through official and multilateral channels. In the absence of those actions, the frictions channel might have accounted for more of the downturn (and the downturn might have been even more severe). However, that case has yet to be empirically verified.
Implications for U.S. Exports
The so-called ongoing “currency wars” is intimately linked with the prospects for imports and exports. Real goods exports are currently increasing at a 9% rate (q/q, annualized), assuming September exports are equal to the average of July and August.
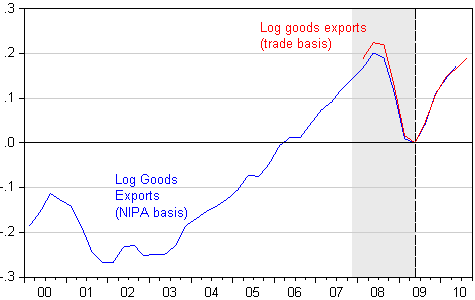
Figure 1: Log real goods exports, SAAR Ch.2005$, NIPA basis (blue), and on a Census/BEA trade release basis (red), normalized to 0 at 2009Q2. NBER defined recession dates shaded gray. Sources: BEA, 2010Q2 GDP 3rd release, Census/BEA August trade release, NBER, and author’s calculations.
Note that, given the assumption September exports match with the July-August average, then goods exports are nearly 20% (in log terms, 20.9% in level terms) above the trough in 2009Q2.
Will the pace of increase be sustained? This depends on a large number of factors, most obviously the rate of growth of the rest-of-the-world’s economy (and where the growth is located, geographically). The finding that demand shocks working through the composition of trade (durables are over-represented in trade, durables are extremely sensitive to business cycle fluctuations) explained the bulk of the drop and recovery in trade suggests the stronger the rebound in GDP, the faster the recovery in trade in proportionate terms.
Just because vertical specialization was not central to the decline and recovery in world trade overall does not mean it won’t be important on a trend basis. That is, increasing fragmentation of the production chain means that exports (and imports) both trend up over time, relative to GDP [3] [paper]. One dissenting view (which asserts that rising income elasticities were a manifestation of a transition from a Ricardian trade model to a vertical-specialization model) implies no further increases in income elasticities (Escaith, Lindenberg, and Mirodout, 2010). (Note that the estimates are based on error correction specifications that omit relative prices.)
Even in the absence of ever increasing income elasticities of exports, as long as rest-of-world growth remains strong, exports should continue to grow strongly. I obtain an income elasticity of goods and services exports over the 1973Q4-2010Q2 period of 1.8 (where rest-of-world income is export weighted) The estimated elasticities here and below are based upon an error correction specification described here.
Of course, dollar depreciation would help things along. On the export side, I find a 10% real dollar depreciation induces a $178 billion increase in goods and services exports (assuming a 20% exchange rate pass through) after 2 years. Note that as of Oct 22, the broad nominal dollar index is down by 6.8% relative to 2010M06 (in log terms). Impending quantitative easing [5] is probably already priced into the dollar, but clearly additional declines in the dollar due to weakening domestic-sourced aggregate demand could provide additional scope for export growth.
I don’t understand how US exports can rise via depreciation of the dollar. US exports will of course be made more competitive but global purchasing-power must fall in step with a dollar devaluation in accordance with the percentage of dollars that exist in the global economy, an amount which is something like two-thirds, IIRC. Triffin Dilemma.
To make matters even more paradoxical, oil prices typically rise as the dollar falls. Had oil been traded in dollars when Triffin devised his theory, perhaps it would have been called something like ‘Triffin’s Double Whammy Paradox’.
Conversely, I have no trouble understanding how a dollar devaluation shifts US debt to the ROW.
I think this is an excellent and informative post. However, one question at the end – if U.S. domestic demand falls and we are already in a liquidity trap (so the decline in demand would not be accompanied by a decline in domestic interest rates), would this tend to cause dollar depreciation, or dollar appreciation, all else equal? The decline in import demand would reduce the demand for foreign exchange …
The world trade collapse in 2008 looks for a culprit,above of this post charts offer the degree of offense, from trade friction 1930 to demand collapse.
In 1930 the financial crisis had a slow timing in its worldwide spread out.It started in the USA and UK all together,reached continental Europe one year after.
Even in continental Europe, the time lags of the crisis effects were noticeable,Germany and then France.Correlatively the recoveries were as well uneven in time.
To illustrate above, in 1930 USA export to Europe were decreased (automobiles down 51%,machineries) by 30% to 1.5 trillion usd, when the imports from Europe decreased by 39%. Smooth Hawley tariff act June 1930, testifies for the trade friction.
2008 looks for a mobile and money (liquidity trap) supplies the usual, still the worldwide time coincidence of the trade collapse is very odd.
Looking in to the World trade data East Asia (China,Tawain,Korea,Thailand,Philipines,Vietnam..) are representing 18.4 % of the world GDP and yet 25% of the world total export.They offer a good sample of integrated production, where any demand chock at one of the component of chain of supply and manufacturing would interrupt the integrated process ( source:Regional productive integration in East Asia Nobuaki Hamaguchi research institute for Economics and business admministration Kobe university).
Was is it the vertical specialization including the manufacturing execution system (on line information on production schedule and material delivery) ?
Reading the charts from P22 to P29 of the same paper, may outline the dependence of the vertical specialization within the East Asia region.It does not supply convincing explanation for the coincident collapse of the world trade in 2008.
useful and helps me define things.
but i am thinking there is large circularity problem in correlating with “demand”
Which isnt actually demand at all but sales. sales that could be, and no doubt were, partly credit constrained?
if you cant import any XXXX you cant buy any XXX?
i am not ready to concede trade finance was a minor contributor yet…?
May I suggest reading conclusion of the World trade organisation P30 on the same topic.
http://www.wto.org/english/res_e/reser_e/ersd201008_e.pdf
Embarrassed in the conclusion when it comes to identify a major cause of the sudden trade collapse in 2008.The same paper has thoroughly included vertical integration,elasticities,funding in its scope of survey.
Are financial markets driven by official statistics?
don: Since there is home bias in the consumption of goods and services, a decrease in home income should induce a greater than proportionate decrease in the relative price of home goods, and hence a decrease in the real value of the dollar. This is a very “real business cycle” interpretation of what would happen, but I’ve never been beholden to one approach or the other. One can put in money with cash in advance motivation; the effect I mentioned would still hold. With sticky prices, the effect would be delayed.
AWH: Trade frictions appear important in certain cases, and apparently different methodologies provide different measures of the importance of trade frictions in the collapse of trade in 2008-09. However, note that trade financing constraints are a subset of these trade frictions, as estimated. Financing could have impacted via other channels, in terms of constraining purchases of durable goods. That was the point I made in my discussion of a paper presented at this conference.
http://www.econbrowser.com always has magnificent ideas.Thanks.