From Reuven Glick and Kevin Lansing, Consumers and the Economy: Household Credit and Personal Saving:
In the years since the bursting of the housing bubble, the personal saving rate has trended up from around 1% to around 6%, while the ratio of household debt to disposable income has dropped from 130% to 118%. Changes over time in the availability of credit to households can explain 90% of the variance of the saving rate since the mid-1960s, including the recent uptrend, according to a simple empirical model.
Obviously, with consumption accounting for 70% or so of GDP, the trajectory of consumption is key to determining growth (as well as to the US current account balance). [1] Glick and Lansing observe:
… most empirical studies seek to explain movements in the saving rate using movements in the ratio of household net worth to personal disposable income. However, some studies have shown that the behavior of consumption, and by extension saving, is also strongly associated with changes in credit growth. Bacchetta and Gerlach (1997) and Ludvigson (1999) find that credit growth has a significant positive impact on consumption growth in the United States and other countries. In these studies, changes in credit growth can be interpreted as capturing changes in lending practices or other factors that affect consumer access to borrowed money. …
The authors compare the predictions of their model, incorporating this credit channel, against those of a standard net worth based model (that is, using household net worth to disposable income as a determinant). The credit variable is the change in the “measure of credit availability constructed from the Federal Reserve Board Senior Loan Officer Opinion Survey…”
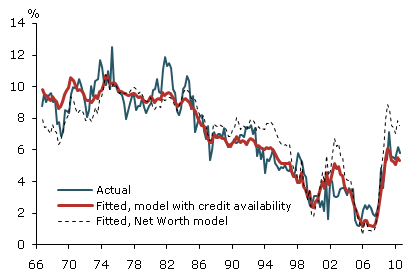
Figure 4 Actual and fitted household saving rates. Source: FRBSF Economic Letter 2011-01
The adjusted R-squareds are 90% vs. 73% for the more restricted model. Thus the evolution of ease of access to credit is going to be key, going forward, to understanding the path of consumption.
Professor Chinn, some months ago Macro Advisers suggested in their blog that the savings function had shifted to the left. So, I made a graph:
https://docs.google.com/leaf?id=0B2lvuts2c4RGNDgyZWFlODgtZGZmZi00NTE1LTk0YWYtM2QxMjI4ZjQwMTYz&sort=name&layout=list&num=50
This seems relevant to the discussion at hand. Any thoughts?
“In the years since the bursting of the housing bubble, the personal saving rate has trended up from around 1% to around 6%, …”
How about looking into whether those with wage incomes above about $100,000 per year are doing all the saving?
“Thus the evolution of ease of access to credit is going to be key, going forward, to understanding the path of consumption.”
I would say it is better to look at people’s budgets (the demand side of debt) with the CORRECT expectations about future real and nominal wages, not what the fed is trying to trick people into believing so the fed can trick people into going into debt again.
The household net worth is in nominal and real term below the year 60s.Could this be the answer to A Greespan,seeking to be challenged on the alternative possible path of central banking during his tenure?
“Modern Times”
A reduction to the the absurd, could be as well consistent with self indulgence.
Assumptions on central bank mandate:
(1) Full employment
(2) Preservation of the payment system (control,rules,implementations).
Few charts additional charts, may be added to the fitted model with credit availability.
Assets at Banks whose ALLL exceeds their Nonperforming Loans (LLRNPT)
http://research.stlouisfed.org/fred2/series/LLRNPT?cid=93
Nonperforming Loans (past due 90+ days plus nonaccrual) / Total Loans for all U.S. Banks (USNPTL)
http://research.stlouisfed.org/fred2/series/USNPTL?cid=93
Asset-backed Commercial Paper Outstanding (ABCOMP)
http://research.stlouisfed.org/fred2/series/ABCOMP
Household Sector: Liabilites: Household Credit Market Debt Outstanding (CMDEBT)
http://research.stlouisfed.org/fred2/series/CMDEBT
Total Consumer Credit Outstanding (TOTALSL)
http://research.stlouisfed.org/fred2/series/TOTALSL
157 bank failures in 2010 (source FDIC website).Much more to come, should analogy be agreed upon.
Savings and loan crisis
http://en.wikipedia.org/wiki/Savings_and_loan_crisis
Multiple conclusions from the reduction to the absurd are left open.None of them are cheering.
“Chaplin told his older sons, he expected Limelight to be his last film.”
what bothers me about all the posts on household saving &/or retail sales is they treat the US population almost as if it were homogeneous, as if the average could somehow represent the typical; yet we see from the 12/15 pew survey that 29% have difficulties affording food, 48% have difficulties affording utilities; these people arent saving…and retail sales were driven almost entirely by the rich:
Cartier and Louis Vuitton have helped boost the luxury goods stock index by almost 50pc since October. Yet Best Buy, Target, and Walmart have languished.
http://governmentagainstthepeople.wordpress.com/2011/01/10/u-s-drifting-from-financial-crisis-to-social-crisis/
maybe someone ought to figure the savings rate for the rest of us…
A quick question regarding consumer spending. It’s my understanding that the consumer spending metric includes a significant percentage of health care costs. First, is that accurate? Second, if it is the case, and since health care costs appear to be rising continually (often in the 8-12% range), won’t consumer spending tend to rise based simply on this and on increasing population? If so, would this really be a reflection of a healthy economy or simply an artifact of two major issues of our time (out of control health care costs and population/immigration)? I appreciate any insight you can provide to my admittedly layman’s understanding. Thanks.
interesting to compare both charts (are the time frame the same?)
U.S. Private Assets Abroad, Net (BOPOPN)
http://research.stlouisfed.org/fred2/series/BOPOPN
Glick and Lansing wrote:
In the years since the bursting of the housing bubble, the personal saving rate has trended up from around 1% to around 6%, while the ratio of household debt to disposable income has dropped from 130% to 118%.
I doubt this is very surprising to many here. The excessive debt that has been incurred by individuals was simply not sustainable. But there is more to this than immedaitely meets the eye.
Savings is calculated as +income -taxes -expenses = savings. Seems simple, but when a home is sold the capital gain on the home is not considered part of income but the taxes paid on the transition to a new home and all expenses associated are included with the expenses. The tendency in the reported savings rate is to understate savings.
But what happens when the turnover in homes declines? There is a lowering of taxes and expenses due to none being incurred in home sales. This will tend to overstate savings relative to earlier calculations with higher home turnover.
This is just one of the many anomalies that make econometric number to be questionable. It is one thing to dream up a formula in a perfect world but it is a totally different thing to actually collect data that reflects that perfect world.
How much of the increase in the savings rate is due to debt being erased through bankruptcy?
“the trajectory of consumption is key to determining growth…”
I disagree. I think investment (both public and private) is the key. Consumption is the tail of the dog. Consumption has risen as a percentage of GDP because of easy credit and a drop in investment.
logic here seems a bit circular. consumer confidence about their finances will put them in the mood to borrow. in the early days, income was the metric against which lenders would lend and so confidence about future income led people to borrow. more recently assets were the collateral and as assets have fallen in value so too has the demand to borrow — and the desire to liquidate has risen. certainly if the credit were not available there would be more saving, but to say credit availability is the driving force is, well, there are better ways to think about this subject.
Menzie,
The authors use a post-1966 data set. The savings rate fell during the Great Depression. What explains that glaring exception to their thesis? Unfortunately, they don’t enlighten us.
The bottom 80-90% of US households have little or no net wealth, apart from dwindling residential real estate equity, which we all know is really the banksters’ asset against which they make additional equity loans.
The bottom 90% of US households receive about half of US income and own just 15% of US financial assets; therefore, the vast majority of US householders are subsistence debtors who work to earn wages so they can afford to work; they do not save or invest, generally speaking, apart from speculating via lotteries and casinos.
The top 10% of US households own nearly all financial wealth, receive half of US income, pay 70% of federal income taxes, do virtually all of the saving and investing, and contribute to nearly half of all personal consumption expenditures.
Thus, with US wealth and income concentration rivaling that of the Gilded Age and Roaring Twentries, and the US economy existing effectively for subsistence of the bottom 80-90% of households, the only possible growth of savings, investment, production, payrolls, and gov’t receipts comes from increase in incomes to the top 10%, and increasingly since ’00 to the top 0.1-1%.
However, the top 1-5% receive an increasing share of their income from rentier sources, including interest, dividends, capital gains, and outsized bonuses and fees from financial transactions; most of this activity is non-productive in that little or no growth of physical capital stock is required. Consequently, there is little or no capital deepening of labor that occurs to produce the rentier gains so that labor receives a proportional share of the net gains.
As wealth and disproportion rentier debt-money gains concentrate to the top 1-10% of households, by definition the rest of the society (firms, households, and gov’ts) becomes increasingly indebted as a result, devoting a growing share of future after-tax wage/salary income to debt service increasingly captured by the rentiers in terms of compounding interest and capital gains at a steep discount rate versus the PV of after-tax labor income.
We reached the private debt Jubilee point not coincidentally with Peak Oil and the final late-Boomer demographic bubble phase in ’05-’07, and now we have begun the terminal faster-than-exponential phase of the process of rapidly approaching the global public (total) debt Jubilee point with US deficits/private GDP approaching 20%, and now the annualized federal deficit nearing total federal receipts.
At the post-’00 trend rate of gov’t spending/private GDP, deficits/private GDP, and deficits/receipts, the US will reach and surpass the critical net interest on the public debt/receipts of 25% by no later than ’15-’16; but the global structural fiscal and larger economic constraints are already being felt in Japan and Europe.
It doesn’t take a rocket scientist to know that the extraordinary rise in household debt since 1985 has been fueled by rampent securitization and erosion of credit and reserve requirements in the banking system… It should come as no shock that “savings” will increase when the access to credit is withdrawn and the securitization industry is in retreat.
David Pearson– Of course FED authors (and the vast majority of modern economists) will not include long-term data, because modeling becomes more difficult with longer data sets and consequent more divergent banking policies. I would suggest that the difference in changes to the “savings rate” between 2010 and 1933 can be explained by the current Federal budget deficit at 10% of GDP/yr and the FED increasing its balance sheet by more than 150%.
Most people are over leveraged and don’t have access to the current low interest rates. Their rent and cost of servicing debt are still very high, and their incomes haven’t kept up for the past decade (or longer?).
This is a good look at Rent/Housing expenses for 1970-2000 relative to disposable income:
http://economix.blogs.nytimes.com/2011/01/07/the-toil-index
The last decade things got much worse, and the fall in housing cost in the second half has not freed up enough income for most people to invest, consume more, or reduce their debt to bring down their cost of servicing debt.
http://www.bea.gov/national/nipaweb/SelectTable.asp?Selected=N#S2
Disposable income has not risen much, but spending on things that I would consider non-discretionary (eg. healthcare, gasoline, housing and utilities) has. This has happened to the extent that I believe people are unable to save/invest adequately.
Since summer, savings as a percentage of DI decreased from 6% to about 5.3% and disposable income only rose ~.3%. I doubt this was due to a decreased demand for savings. The “non-discretionary” expenses I mentioned increased as a percentage of DI income by more.
Look at BEA table 2.6 for disposable income, it has monthly resolution. Look at 2.4.5 for expenditures by product type, this only has annual resolution. Table 2.8.5 has monthly expenditures by major product type.
Brian M,
When I looked at the BEA data on personal income and consumption expenditures two months ago, this is what I observed:
I suppose the decline in savings could be seasonal.
Incomes were pretty flat for the broader population for quite a while and prices kept rising. We saw a big spike and prices dropped when everything melted down; however, I think we never returned to pre-2005 trend price levels or prices relative to disposable income after non-discretionary expenses.
Glick and Lansing’s work is progress by moving in the right direction, but two issues remain. First, the use of Sr. Loan Officer’s impression of credit availability seems inexact and circular. I would be interested to see results from using appropriate interest rates. Second, population age mix changes should be taken into account. ‘Savers’ cluster in younger age families and ‘non-savers’ cluster in older families. We have had a large change in this mix over the past 45 years and we will see even larger changes in this mix in the next 15 years. It needs to be taken into account to explain/project a macro savings rate.
MarkS,
I can see how using older data would make it difficult to quickly knock out another paper. However, nothing is stopping the authors from using the least costly analytical tool to look at out-of-sample data — plain old logic.
The influence of the fiscal deficit is something I thought about. In 1930-1933 the savings rate fell steeply, probably as a result of the unemployed spending their savings. This happened even as the rest of the population lost some access to mortgage and installment credit. Now, in 2010, the unemployed spend fiscal transfers instead. How does this impact the authors’ thesis? Should we expect the savings rate to decline following a financial crisis in the absence of government transfers? If so, then is credit availability the dominant factor, as the authors suggest?
David Pearson-
I’m right with you on the logic angle. Of course, in a real liasez faire capitalistic system, a banking/solvency crisis will result in credit retrenchment and consequent savings depletion. In the present world of plutocratic socialism, monetary manipulation by government and the central bank, will consume everything not nailed-down in a desperate effort to keep the privileged in their deck chairs.
I’m in agreement with Glick & Lansing’s results from a logical viewpoint however: With easy credit availability, households can acquire “stuff” without cash. When credit evaporates, the same households have to save cash before they make their purchases… I would suggest that some portion of the “savings” growth between 2008 and 2009 relates to households reverting to a cash rather than credit economy…. Wait long enough, (another ten years), you’ll probably see savings erosion during credit tightening when the bag-of-tricks is empty.
Report from the great white north!, 24 more months of cold weather before the thaw. Since late 2008, I have been constant in saying early 2013 is the start of the recovery in consumer spending. Debt is being paid down, at the same time we are working down the inventory of stuff we bought, but never used. Once stuff is used up and debt is paid down, new economy can move forward. True prosperity is at the very least 6 years away for the average worker and will come as the 2.0 trillion U.S. dollars in corporate profits sitting off shore begins to return as new administration tells them, we’ll give you good tax rates, you create good jobs. Seems so simple, doesn’t it!
“Changes over time in the availability of credit to households can explain 90% of the variance of the saving rate since the mid-1960s, including the recent uptrend, according to a simple empirical model.”
Just so people don’t interpret this as meaning a return to unsustainable debt accumulation is the path to “recovery.” I’m afraid that is a natural albeit dumb first reaction. What the paper has missed is that the overall level of debt can be a ceiling on new borrowing. This is noted in some of the above comments.
Consumption maintained from government transfers is fine, as long as the foreign trade leakage does not result in too much of the AD going abroad, so we are left with the debt but without much of the fiscal stimulus. I’m afraid the leakage will make the transfers not worth the cost going forward.
Don, you might like this article my brother sent me:
http://advisoranalyst.com/glablog/2011/01/06/hugh-hendry-investment-outlook-winter-2010-11/
aaron – thanks. An entertaining read.
True savings haven’t changed since Joseph and the Pharaoh. Now there is the illusion that somewhere something real is being put aside and not consumed. Right. Per capita real savings world wide is negative(high burn rate). It doesn’t matter if some nominal financial number is 0 or 6.
The technical def of consumption includes all money’s paid into SS. I get a similar ar^2 using the rise in the SS income cap/SS rates as the causal factors. Changes in the technical def of income and consumption have acted to decrease savings rate as well as increase GDP. For example, 401(k) matches are both income and consumption when paid. It isn’t available for use in the partial reserve banking system so it isn’t savings. Even more interesting is the double counting build into the system as these moneys will again be income and consumption when they come out of the 401(k).