Yesterday’s NYT article, Crises in Japan Ripple Across the Global Economy noted:
In the wake of Japan’s cascading disasters, signs of economic loss can be found in many corners of the globe, from Sendai, on the battered Japanese coast, to Paris to Marion, Ark.
…Volvo, the Swedish carmaker, was working with a 10-day supply left of Japanese-built navigation and climate control systems.
“It’s hour-by-hour work to get a grip on the situation,” said Per-Ake Froberg, chief spokesman for Volvo, as it girds for a production halt.
Breaking Down the Effects
At this juncture, it’s useful to categorize the various effects emanating from this shock to the Japanese economy (the article actually covers oil and sovereign debt shocks as well). First, there is the aggregate demand shock, as Japanese spending either falls or rises over time; there is a composition of spending effect, as spending shifts, perhaps toward investment and away from consumption. Both of these have some implications for US (and rest of world) exports.
Second, there are supply side/trade effects, highlighted by the article. That is, Japan is a provider of some key inputs into the production of electronic goods. From the article:
- At Shin-Etsu Chemical, the biggest maker of silicon wafers used for microchips, production was halted because of quake damage at its main plant.
- A Texas Instruments chip fabrication plant in Miho, Japan, that produced 10 percent of the company’s output suffered “substantial damage” and might resume full production only in July.
- …
- Sony initially suspended operations at 10 factories — making Blu-ray discs, lasers and lithium-ion batteries, among others — and two research centers. Some have been restarted, but others are damaged.
Toshiba, the world’s second-largest maker of computer chips used in devices like smartphones, tablets and digital cameras, has closed some production lines.
Production Fragmentation, Vertical Specialization, and De-Globalization
What are the implications of a fragmented production process, combined with lean production, for the propagation of shocks throughout supply side? Bems, Johnson and Yi (2009) discuss vertical specialization, and the implications for the propagation of shocks, while Tanaka (2009) notes that Japan is a particularly sensitive to shocks to the supply chain. If power is restored quickly to factories, or multinational firms are able to rejigger sourcing (e.g., supplying car engines from the US for Japanese made cars), then there should be minimal impact on aggregate supply (and more relative price changes than general price level increases).
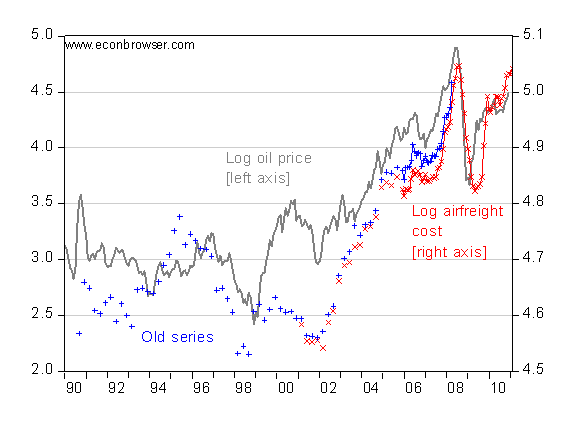
A more interesting question is what the shock, combined with other trends, has for the future of vertical specialization. The cost of energy comes into play in the sense that some of the fragmentation of the supply chain has been induced by reduced transportation costs, trade liberalization, and the development of information and communication technologies over the past two decades. The second and third factors are still in play, but transportation costs are closely linked to energy prices. [3] This is particularly true for air transport.

Figure 1: Log price of oil per barrel WTI (gray line, left scale); log index of inbound air freight (red line, right axis), old series (blue line, right axis). Source: St. Louis Fed FREDII, and BLS.
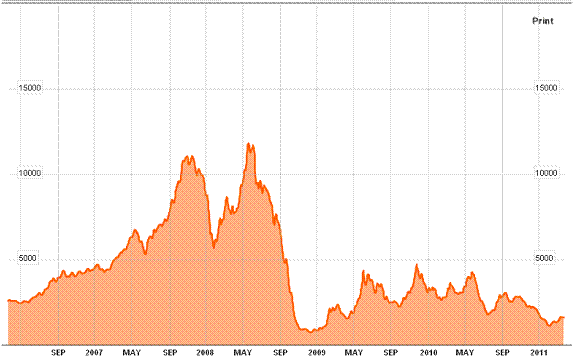
In contrast, the cost of seaborne transportation, as measured by the Baltic Dry Index, remains far below peaks achieved in 2008.

Figure 2: Baltic Dry Index, March 2008-March 2011. Source: Bloomberg.
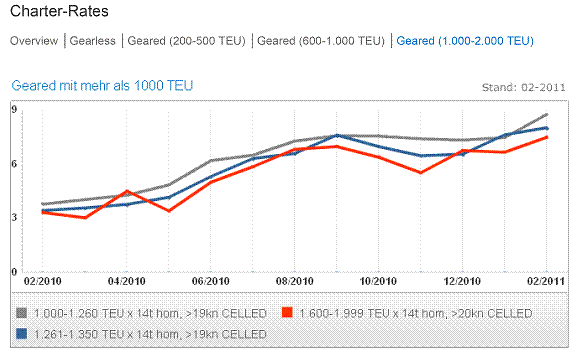
Updated 4pm Measures of container shipping costs are also rising, but are far below 10.77 recorded in 2008, at 3.31 as of February 2011.

Figure 3: HAMBURG INDEX – Containership Time-Charter-Rates; Container T/C rates (geared, 1000-2000 TEU). Source: Koenig & Cie..
TEU is short for “twenty foot equivalent unit” where a standard 40 8 8 container equals two TEUs. Prices “in USD pro 14t/TEU pro Tag”
Seaborne freight costs are apparently less affected by fuel costs, and more influenced by the stock of available ships (ships ordered in 2007-08 are now coming into service); the latter has been increasing putting downward pressure on transport costs. [4]
In other words, not all transport costs are rising. The change in the relative costs of transport modes should have some interesting implications. While about 90% of freight is moved by sea by weight, a much higher proportion of the value of freight is moved by air. (Harrigan (2010) observes that by about 2003, over 20% of total value of imports arrive by air; close to 40% if one excludes NAFTA in the calculation of imports).
To the extent that production fragmentation relies upon just-in-time inventory management, a reversal of the trend in decreasing air freight to sea freight costs would induce a deceleration of the process of production fragmentation, or perhaps even a reversal.
Harrigan (2010) also notes that the pattern of comparative advantage for trade in final goods should also change.
Macro Forces and Macro Implications
Higher energy prices could reduce the extent of production fragmentation/vertical specialization. To the extent that higher energy prices are offset by greater supply of sea freight capacity, we shouldn’t expect a big impact on transportation costs for final (as opposed to high-value intermediate) goods, so the insulating effecs I conjectured in this post would probably not come to pass.
However, if the costs relevant for vertical specialization change at the same time as relative factor prices and the geographical location of demand sources change, one trend that we might see would be an overall flattening out of the trend toward vertical specialization. That point is made in this FT article:
The global supply chain made sense when most of it pointed in the same direction — from Asian producers to western consumers. As Asia and Latin America join the consuming bandwagon it will make more sense for multinationals to site production and assembly close to their customers, which has the side effect of cutting transport costs.
That is likely to mean a return to regional production centres, with Chinese factories switching from exporting to producing for Asian consumers and new factories making goods for the US being sited in Latin America. One spin-off advantage will be an increase in production flexibility for companies essentially making the same product in two or more global locations.
That will simplify those complex supply chains, helping companies to cope with shocks like the one inflicted by Japan’s earthquake. But this shift from “offshoring” to “nearshoring” is being driven by growth, not natural disasters.
I agree that macro forces (location of demand, relative factor prices, transport costs) will dominate, but I also think the demonstrated sensitivity to supply disruptions might also alter the calculus of offshoring/onshoring-vertical specialization that firm managers make. This in turn will have implications for trade flow sensitivities to exchange rates. [5] [6] It might also have implications for wages and income distribution. [7]
Supply chain shocks are non-linear, they build up form scratch over 1-2 weeks time to a total constipation in the system, creating queues which may be months long. Especially in just in time manufacturing with minimized buffer stocks along the chain or cumulatively in the chain.
Its mathematics is similar to traffic jam buildup and dissemination, a very tricky thing.
So , in the end, the effects are unpredictable and long to overcome when many such lean chain disruptions coincide in time and space.
One thing that happens is that everyone along the chain starts to build up safety stocks, further amplifying the initial small deviation of supply interruption. Byers start to compete for scarce supply to protect their supply chain and thus sharply increase the aggregate demand in time when their buying in fact should be rationed.
Note that the Baltic Dry Index measures the cost of dry bulk transportation and as such only captures certain raw materials transportation markets, primarily grains, bauxite, iron ore and coal.
I would think that finished goods transportation costs using containerized methods is a much better proxy; furthermore, container shipping rates should show a much higher correlation to oil prices than the Baltic Index. Container cost data is not free unfortunately, although it is available from private ship brokers (Clarkson’s, Alphaliner)
The actual bad news is that companies will move production from Japan to spread their risk. That will be driven by end buyers who are now more aware of earthquake risk and of course by the producers themselves responding to customer demands.
I think we need to be a bit careful about some of these day rates. The press is recently replete with stories about slow-steaming, that is, about ship operators reducing steaming speeds to conserve oil. If you need more days to get there due to high oil prices, the day rate might not be the best metric.
http://www.joc.com/maritime/carriers-move-full-speed-slow-steaming
http://seekingalpha.com/article/216899-slow-steaming-to-affect-retailers-as-shipping-supply-and-demand-are-out-of-whack
Dave: Thanks for the comment; I’ve added container ship rates, for Hamburg which relates to a large proportion of total container shipping.
Steven Kopits: Good points. I’m not an expert in this area, so I don’t have a good feeling for how much bias is imparted by using reported day rates. Any additional information would be welcome.
Neat post. In a sense, high energy costs could be a positive for world rebalancing, since it makes Chinese/Asian imports less competitive with domestic production.
If you look forward 5-10 years and try to imagine what would help get the U.S. out of it’s current situation, rebalancing trade is probably the best hope.
Menzie Seaborne freight costs are apparently less affected by fuel costs, and more influenced by the stock of available ships (ships ordered in 2007-08 are now coming into service); the latter has been increasing putting downward pressure on transport costs
Part of the run-up in seaborne freight costs was due to the demands of the military crowding out private sector trade. The supply curve for seaborne shipping is relatively inelastic and in normal times there isn’t a lot of excess shipping capacity. It’s a capital intensive industry and you can’t sit on a lot of idle capacity. But five or six years ago the military started to bid up shipping costs in order to deliver materiel to the Gulf. I remember that at one point the US Army had over 160,000 TEU CONEX containers sitting in theater, with many of those being commercial containers.
My understanding is that the big driver in seaborne transportation isn’t the actual over ocean cost of propelling the freighter, it’s the port handling costs. There are significant economies of scale in port handling, but economies of scope are a more difficult matter. Basically it’s a bad idea to have ports specialize in types of cargo. This was something that the Army’s Responsible Retrograde Task Force (R2TF) had to consider as the US draws down troops from Iraq. It’s a balancing act; you want to reap economies of scale at ports, but you don’t want to disrupt the private sector again by gobbling up global shipping capacity. One good primer on the economics of ports is the World Bank Policy Research Working Paper #3151, “A Multi-output Cost Function for Port Terminals,” Oct 2003. It helped frame a lot of my thinking in optimal retrograde modeling.