The WSJ and Philadelphia Fed surveys of economists were released last week. It’s of interest to consider what they imply for the macro outlook, and additionally, how they believe inflation will evolve as a function of other variables.
The Macro Outlook
Because the WSJ and SPF forecast mean are essentially the same for GDP, I’ll focus on the WSJ forecasts. Figure 1 depicts the forecast mean, and trimmed high and low forecasts (where trimming is based on the five quarter growth rates).
Figure 1: GDP (blue), WSJ forecast mean (red), and trimmed high (Lavorgna/Deutsche Bank) and trimmed low (Leamer/UCLA) (gray), all in bn Ch.2005$, SAAR. Trimming removes top and bottom five respondents. NBER defined recession dates shaded gray. Source: BEA, 2011Q1 advance release, WSJ May 2011 survey, NBER, and author’s calculations.
Forecasters predict continued growth. However, there is some dispersion of forecasts. Moreover, while growth is predicted to continue, it will not be at such a pace to quickly close the output gap.
Figure 2: Log GDP (blue), WSJ forecast mean (red), and trimmed high (Lavorgna/Deutsche Bank) and trimmed low (Leamer/UCLA) (gray), and potential GDP (CBO January 2011), all in bn Ch.2005$, SAAR. Trimming removes top and bottom five respondents. NBER defined recession dates shaded gray. Source: BEA, 2011Q1 advance release, CBO, Budget and Economic Outlook (January 2011) data, WSJ May 2011 survey, NBER, and author’s calculations.
Figure 2 indicates that by 2012Q2, forecasters are projecting output at 3.8% below CBO projected potential GDP (in log terms). The trimmed high is 3% below, while the trimmed low is 4.5% below. Even a 3% output gap by mid 2012 is substantial, and suggests to me that policymakers need to be extremely circumspect about tightening policy over-rapidly.
The graph is useful in reminding us of the cost of the recession, which started in 2007Q4. As of 2011Q1, the cumulative output shortfall relative to potential GDP was 2.1 trillion Ch.2005$. Using the WSJ mean forecast, as of 2012Q2, the cumulative output shortfall will be 2.9 trillion Ch.2005$ — and the output gap will still be 3.8%!
These forecasts are conditional upon certain policy measures. One of those is monetary policy; here it is of interest to note what monetary policy is assumed to do.
Figure 3: Fed Funds (red), WSJ forecast mean (red squares), ten year constant maturity (blue), and ten year note yield (blue triangles), all in percentage points. NBER defined recession dates shaded gray. Source: St. Louis FREDII for interest rates, WSJ May 2011 survey, and NBER.
What is interesting to me is the fairly gradual upward trajectory for the ten year interest rate — and how those projected interest rates compare against those earlier in the decade.
I can understand how some people might ask how interest rates can be so low with such a large budget deficit. But in a loanable funds framework, saving and demand for total credit determines the price of bonds, and as long as private demand for credit is depressed (consistent with a 3% output gap), real rates should remain relatively low. Shocks to risk appetite could also induce flight to US Treasurys.
An alternative interpretation of these rising interest rates is that inflation is expected to rise, despite the fact that Treasury-TIPS spreads and other measures of expected inflation [0] exhibit muted pressures. The short to medium term inflation expectations are also muted in the WSJ survey:
Figure 4: Actual CPI y/y inflation (blue), WSJ forecast mean (red squares), and trimmed high (Riding,DeQuadros/RDQ) and trimmed low (Harris/UBS) (gray +), all in percentage points. NBER defined recession dates shaded gray. Source: St. Louis FREDII for interest rates, WSJ May 2011 survey, and NBER.
Inflation Dynamics
One interesting question, given the pervasive (among some circles) belief that hyperinflation is just around the corner, is what determines inflation. The Phillips curve posits current inflation is a function of expected inflation, the output gap, and input price shocks.
π t = π et + f(yt-y*t) + Z t
Where π is inflation, the e superscript denotes expected, (yt-y*t) is the output gap, and Z is a function of the growth rate of input prices. For average inflation rates close to zero, the expected inflation term can be approximated by zero.
The WSJ survey does not contain an estimate of the output gap, but one can take a look at how forecasted inflation rate over the next year correlates against the forecasted growth rate of GDP:
Figure 5: Average forecasted y/y inflation versus average q/q annualized growth, all in percentage points, excluding James Smith/Parsec Financial Management, n=53. Nearest neighbor fit (bandwidth=0.3). Source: WSJ May 2011 survey, and author’s calculations. [Figure corrected 6/26, 2:40pm, drops Jim O’Sullivan/MF Global (no obs)]
Running a regression of average forecasted inflation against average forecasted growth, and the change in the average forecast oil price from $100 leads to the following estimates.
π t = 1.05 + 0.53 × Δ yt + 0.03 × ΔPoilt
Adj-R2 = 0.32, SER = 0.52, d.f. = 54.
[Sample corrected 6/26, 2:40pm, drops Jim O’Sullivan/MF Global (no obs.)]
π t = 1.94 + 0.25 × Δ yt + 0.176 × ΔPoilt
Adj-R2 = 0.02, SER = 0.49, d.f. = 53.
Where Δ yt is the average q/q growth rate, and ΔPoilt is the change in the average price relative to $100, and bold coefficients are statistically significant at the 10% msl. In words, most business economists believe more rapid growth is associated with higher inflation. It’s possible that it’s monetary policy that is believed to drive both growth and inflation jointly (of course, that would be inconsistent with what has often been characterized as a Keynesian view of the world, but consistency and familiarity with data is not a strong point amongst those who are most worried about hyperinflation [1]).
Proxying the looseness of Fed policy by average Fed funds rate in 2011, one finds there is no link of looseness with higher inflation in 2011-2012. In fact, it is the reverse; in a OLS regression, higher average expected inflation in 2012 is associated with tighter policy in 2011, significant at the 5% msl (and with higher increase in oil prices). (The adj-R2 = 0.12.)
Figure 6: Average forecasted y/y inflation in 2012 versus average average Fed funds rate in 2011, all in percentage points, excluding James Smith/Parsec Financial Management, n=53. Nearest neighbor fit (bandwidth=0.3). Source: WSJ May 2011 survey, and author’s calculations.
In other words, expected inflation does not appear to be primarily a function of loose monetary policy. Rather, it appears to be driven by factors consistent with a Phillips curve relationship obtaining.
Views on Policy
Economists in the business sector tend to have a view of the world consistent with an expectations and supply augmented Phillips curve, and inconsistent with a strict monetarist/Quantity theory view (or a strict real business cycle view).
It’s of interest, then, to consider what their views on the policy outlook are. Figure 7 highlights the monetary policy outlook.
Figure 7: Quarter in which Fed begins raising the Fed funds rate (blue bars) and when the Fed begins exiting quantitative easing by allowing “mortgage-backed securities to mature without being reinvested.” Source: WSJ May 2011 survey.
The modal quarter for QE exit is 2011Q4, while that for Fed funds tightening in 2012Q1. I can see how these dates can be rationalized within the context of a sustained, albeit moderate, recovery in GDP. However, I worry about overly rapid tightening against a backdrop of ill-advised over rapid tightening of fiscal policy.
This is particularly important to recall, in this time of fears of debt accumulation, that much of the accumulation of debt as a share of GDP occurs because of Bush era fiscal policies and the economic downturn, as highlighted by the CBPP:
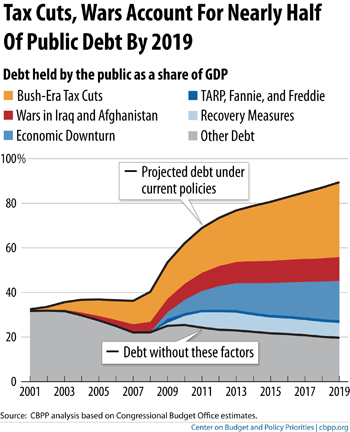
Source: CBPP.
One can see that a large chunk of the debt accumulation is attributable to the 2001 and 2003 tax cuts. The economic downturn is another key contributor.
As Aizenman and Pasricha observed, the fiscal stimulus merely offset the Contractionary effect emanating from the state and local government spending cuts and tax increases. The proposals to cut spending out of the next fiscal year’s budget, without addressing out-year spending and revenue, will merely increase the dark blue component (“economic downturn”) in the above graph.
The WSJ economists (not a notably liberal group, when it comes to economics) also do not appear to be strong adherents of the “expansionary fiscal contraction” view (see my views here and here). In the March survey, the response to the question “Will cutting the federal budget by an annualized $100 billion this year help or hurt economic growth over the next two years?”, was roughly 50-50. My favorite quote was “Claims that cuts are stimulative in the short run are nonsense.” I think we should take this comment to heart, as we wonder if oil prices and other shocks might push us below “stall speed”.
“much of the accumulation of debt as a share of GDP occurs because of Bush era fiscal policies”
At what point (if ever) do you assign responsibility for the current budget deficits on the current administration?
What and How Do Business Economists Think? “Cogito ergo sum”,”I think, therefore I am” Descartes
The choices to be and to think are infinite and therefore the main line of thoughts is sometimes difficult to perceive.When convenient Taylor rules (Econbrowser ,The Taylor Rule and QE2) but not alone Laspeyres may cast doubts on inflation (see Econbrowser multiple posts on the subject M Chinn,J.Hamilton)
Where π is inflation, the e superscript denotes expected, (yt-y*t) is the output gap, and Z is a function of the growth rate of input prices.(input prices which reached 2.7% in the year to March.ECB may monthly bulletin.P15)
http://www.ecb.int/pub/pdf/mobu/mb201105en.pdf
Those are statistical noises the inflation expectation is controled but the survey is wrong and always wrong (Econbrowser Core, and More, Near Zero)
ECB monthly bulletin January 2011 (P49)
The output gap is mythic without inflation but the debts are not.
Jeff, if you read the chart — I know that is a lot to ask of someone like you who thinks they already know all the answers — you will see a segment labeled ” recovery measures”.
Do you see it?
That is how much of the current deficit is due to actions by the current administration.
True, Bush started cuts which changed the regime of USA debt from normal to potentially superexponetial.
But it was with 2008 crisis and measures to spend way out, and extension of Bush cuts into Obama cuts that it turned definitely superexponential, hence, likely to “crash correct” – i.e. get smaller in an unexpected, short term event mode.
Blame game is nice, but its over. The question should be what to do as time leaves less and less options.
The USA default (crash correction of debt by some significant, >20% amount) after all these events is not a question of if, but when and how – who will get haircut. With devaluation – everyone, but there may be other ways to default on debt. E.g. by restructuring the biggest portions ( as it gives more effect) or by restructuring the weakest hands ( as it is inviting less retaliation).
I think the USA will go for first option, that is, default on foreign loan owners.
Menzie, I’ve seen the CBPP chart several times this weekend and am fascinated by the story it tells. Starting when spending and revenues were nearly equal, we see that Bush actually controlled spending at the rate of GDP growth. Then the economy tipped over into a deep recession causing revenues to also plummet.
It also has a point of confusion. If the chart shows the Bush tax cuts were actually going up in debt impact from their inception, and the deficits were actually going down during part of that period, what was causing the Bush tax cuts to increase the percentage of debt held by the public? If deficits are going down that means borrowing should also be following. What’s going on there?
I conclude just the opposite wrt the reaction to oil prices.
The historical record best supports the notion that high oil prices will lead to an oil-shock induced recession, probably between Q3 2011 and Q2 2012, or so. Maybe there’s a soft landing scenario out there–perhaps “porpoising” where higher oil prices lead to lower growth, which lowers oil prices, which leads to higher growth, and so on. But today that’s speculation, not demonstated track record, and we don’t have a theoretical basis for thinking so (at least not yet).
Now, if we have an oil shock, should we then double down and increase debt even more? Do we think the economy can sustain a deficit at, say, 12% of GDP? Is that feasible? And how long? We’re entering an oil shock only two years off the trough of oil consumption. Do you think oil price pressures will be all done and over with after this next recession?
Or will we have shot our powder and find ourselves having to enact contractionary government policies in the heart of the coming recession? For my part, I’d rather keep more powder dry now.
But in any event, that’s why I suggested, some months back, that I’d like to see an analysis of the impact of an oil shock on GDP, employment and fiscal balance. As we were then, we are still flying blind today in the face of the top economic risk facing the country.
Aren’t low interest rates deflationary — that is, savers experiencing lower incomes become anxious and reduce their expenditures causing demand to fall?
I can see that mortgage refinancing (assumes Fed funds rate controls mortgage rates) would increase disposable consumption income, but haven’t most if not all candidates for refinancing refinanced by now?
Why would we want low interest rates, now, when we want to increase demand?
See GDP, jobless claims over at CR.
Only two possible explanations for this, no?
– oil prices
– deficit
CoRev, I believe part of the answer to your questions is that the tax cuts were renewed because – emphasize – deficits had grown large. When they were renewed in 2004 (2005?), the deficit was projected at about $480B, the highest ever in “peacetime,” if we can call this peacetime. The idea was the economy had suffered jolts from 9/11 and the wars in Iraq and Afghanistan and that it needed the tax cuts to spur higher growth. The deficit didn’t matter. Neither did the total debt.
There was also a lot of talk then that GWBush had inherited the end of a business cycle, that the dotcom crash had left an impact, and that the business cycle was picking up so renewing the tax cuts was necessary because allowing them to expire would hurt the economy. The business cycle did improve somewhat but that turned out to be intensely related to the housing and finance bubble.
I don’t have a political argument here. At the time, I was agnostic about the tax cuts, neither worried about their deficit effects nor about how expiration would hurt the economy. I thought there was a real estate bubble, but not a huge bubble that would dramatically change the financial industry. These turned out to be really bad choices, but they were somewhat rational at the time.
In most sciences, an equation like the Philips curve that has no measurable parameters–only estimated numbers to be plugged in–would be laughed out of the room. Such equations are used to “curve-fit” the data after the fact. Like you just did. But in this business, it is treated as a key insight and policy tool.
All you actually did was prove that “most business economists believe more rapid growth is associated with higher inflation.” We didn’t need a facade of mathematics to prove this.
Inflation moves far too slowly to determine how monetary policy affects it, when you just use a 12-month sample of FFR, which has been consistently held near zero.
Dismal science, indeed.
First I chuckled when I saw MC appending this digression to a post that is ostensibly about forecasts. Then I realized that this chart looks very fishy. The Bush tax cuts are responsible for a debt of 40% of GDP in 2019? Viewed another way, TARP, FM2 and “Recovery Measures” are responsible for 30% of GDP debt projected to 2019. As CoRev stated, if the deficit was approaching zero when the economic downturn hit (with the Bush tax rates in effect) why is it suddenly the culprit? Why is there no “economic downturn” noted in 2001? As I recall, analyses showing where the “surplus” went in the early 2000’s showed that the only about 40% of the change was due to the tax cuts.
Why exclude part of the debt by counting only public debt? The total debt is projected to be $21.4 TN in 2020 versus about $15TN of public debt. Can we just forget about that extra $6.4 TN? Was/is it not expected to be spent? Is it not counted in calculating the long-run fiscal health of SS and Medicare?
Finally, it seems to me that the graph should have had a category for Hurricane Obama, Destroyer-in Chief.
Menzie,
Do you ever take into account the work of David and Christina Romer finding the a 1% tax cut generally leads to a 2% increase in GDP. And conversly a 1% tax increase leads to a 3% decline in GDP.
See Christina Romer quote while she was a part of the Obama administration here.
See the Romer’s studyhere. A quote is below.
So if Obama CONTINUES the Bush policy of debt financing two wars, adds to it a debt-financed stimulus, and CONTINUES the Bush tax cuts…..the projected deficits over the NEXT ten years are attributable to Bush!
What magic ! Perhaps the (not so) “nonpartisan” CPBB can change Obama’s name to Bush.
Ricardo: In scoring, I stick to the CBO approach. But I do know the Romer and Romer paper. You would be well advised to read the entire paper. I have a relevant quote about tax increase impacts in this Aug 2008 post.
Another peculiarity that I noticed was that debt as a percentage of GDP rose in the early Bush years, but not so steeply, and then began to decline until 2007 after which it increased and then skyrocketed. What could have happened – did Bush go nuts with spending in his 3rd term?
Also, I believe that the Bush tax cuts went primarily to the non-rich, so repealing them means that those non-rich would pay a lot more tax. But let’s not say too much about that so as not to disturb the little people.
Menzie, now that we have some history to compare the Romer multipliers, has anyone calculated them?
CoRev: You would be well advised to read my post on the paper as well as the paper itself. One thing you might note if you read beyond the abstract (and in addition to one or two sentence characterizations of some of the results) is that there is considerable nuance in the multipliers estimates. Exogeneity is one issue. Another is the purpose of the tax increases; as I noted in the post, when the tax increases are for deficit reduction, then the multipliers are much smaller in absolute value.
We can’t assess the change in the multipliers until a narrative approach is applied to tax changes that occurred subsequent to the sample period examined by Romer and Romer (duh!). (However, Romer does have new data on interwar tax changes.)
Anonymous (1:43PM): Take a look at this post for a graph of budget balance by FY. Tax revenues started to decline with the bust in the housing market, and in addition there was a first stimulus package in early 2008 (in the last year of the Bush Administration). Take a look at Figure 1 in this post for some higher frequency observations on debt to GDP (also recall that as the denominator trends down, debt/GDP will tend to look larger).
Rich Berger: Aside from being a standard approach of looking at net debt, let me ask you — in the case you are married, do you look and report your individual debt, separate from your wife’s, when you consider your overall household financial situation.
Dan Nile: You would be advised to take some engineering classes. My first published paper used a “smoother” developed by statisticians and used in engineering problems, and applied to estimating economic relations — so I’m not sure I understand the sharp dichotomy you’re pointing to. Or is engineering soft in your mind. OK, my brother has a PhD in solid state physics; he collects data and runs regressions to isolate certain estimates — to me, it’s not clear that tensile strength or piezoresistance is a fundamental parameter since, after all, these might change depending on material, temperature, etc.
So, you might want to read a couple econometrics textbooks to develop a more sophisticated critique of econometric methodology. There are many; but the ones you have put your finger on are sophomoric at best.
Menzie, thanks for the typical college prof answer to a simple question from a student, “here are some sources go find it yourself.” I really am smiling, and not trying to bust on you.
My gut feel is that both she and Zandi’s estimates were dramatically wrong, so the multipliers used were not correct. Assuming, of course, that their estimates could be refined to identify the multipliers and their impacts. But, OTH, that’s why we have economists.
CoRev This paper is about as recent as you’re going to get. It’s a Fed working paper from 14 May, “Fiscal Spending Jobs Multipliers:
Evidence from the 2009 American Recovery and
Reinvestment Act”
http://www.frbsf.org/publications/economics/papers/2010/wp10-17bk.pdf
They estimate 3 million jobs saved or created through March 2011. Also, Menzie referred to an exogeneity problem. It turns out that the Fed paper brings up this same issue (page 27):
The jobs multiplier of ARRA spending may increase or decrease over time as the intertemporal distribution (i.e. how front-loaded or backloaded is the spending for a given level of cumulative-to-date spending) and the composition of the spending (across agencies) changes over time. Moreover, the cumulative response of employment to past ARRA spending-to-date will reflect the lag structure (impulse response function) governing the effects of spending on employment – that is, how long it takes for spending to maximally affect recipients’
hiring/retention decisions and how lasting are any ARRA-induced jobs. As mentioned in Section III, estimating an impulse response function with respect to ARRA spending is precluded by the fact that the instruments do not vary over time and therefore I do not have separate instruments for each lag of stimulus spending (each of which is likely to be endogenous). In other words, absent some exogenous determinant of the monthly flow of ARRA spending, the exogenous component of this monthly flow is unidentified. It is only the
exogenous component of the cumulative stock of ARRA spending to date that is identified by the
instruments used in this paper.
2slugs, this seems to be the conclusion: “Across different types of spending, the results suggest that infrastructure spending and unrestricted fiscal aid have large, positive jobs multipliers, especially in the state and local government and construction sectors, while “strings-attached” aid to state governments for Medicaid reimbursement may actually reduce state and local government employment. Lastly, I find that ARRA spending appears to have increased both jobs gains (from opening/expanding businesses) and job losses (from closing/contracting businesses).”
Can anyone deliver good reasons to convince me that the US economy was running exactly at its potential (and not above) in 2007?
Menzie-
That was a weak answer. A more appropriate analogy might be that my beloved wife is taking in more than she needs today and gives me the excess to put aside for her retirement. I spend the money, and she comes back to me several years later asking for her money. Not knowing what to do, and not having the money, I put a mask on, rob my neighbor and come back with the money. Problem solved, but my neighbor is poorer.
The more I think about this graph, the more fraudulent I think it is. The only reason the Bush tax cuts are said to be adding to the debt is because the current misadministration has no fiscal discipline, none whatsoever.
In fact, the USA military spending is very small historically right now, even with 2-3 wars.
http://www.americanthinker.com/2011/05/the_budget_how_we_got_here.html
So that can not be in the military the savings should be searched for, but in government and entitlements.
Actually those last few Anonymous posts were mine. I realize that spending rose and receipts tanked during the last FY of Bush’s administration. But those were not a consequence of the tax rate cuts. My point was that the budget was on track for surplus had it not been for the financial crisis, so the idea that the Bush cuts are making our debt larger ignores the explosion of wasteful spending by the current regime. And they intend to continue and expand this spending. Effectively, the debt segment labeled Bush tax cuts could easily be labeled – Money we Need from the Taxpayers to Continue to Spend the Way we Want to.
And lest we forget, most of those tax cuts/potential spending increases are for the non-rich (as defined by the regime). The money to support the current entitlement programs is going to come from everybody, not just the “rich”.
Rich Berger My point was that the budget was on track for surplus had it not been for the financial crisis
Where did you get this nonsense? Try looking at the CBO historical tables. In Feb 2008 the CBO published their updated forecast for FY2008 and beyond. This was the last forecast before the onset of the recession, so let’s use that as the baseline. It’s the most optimistic if you’re a Bushie. The CBO projected a closing of the unified budget deficit to only 0.7% by 2012, but note that this reflected the contribution from the growing FICA surplus and, it also assumed the Bush tax cuts expired as scheduled. On Table 1-8 the CBO looks at what happens if the tax cuts are extended. They look out from 2009 thru 2018. According the CBO’s analysis back in Feb 2008 the effect of the Bush 2001 tax cuts amounted to $2.46 trillion thru from 2009 thru 2018 and another $0.47 trillion in debt servicing costs attributable to extending the 2001 and 2003 Bush tax cuts. So that’s ~$3 trillion according to CBO…and remember, this is before the recession.
The CBPP analysis used the JCT & CBO’s Table 1-7 from Jan 2011:
“We added the cost of extending them from estimates prepared by CBO and JCT.[18] Together, the tax cuts account for $1.7 trillion in extra deficits in 2001 through 2008, and $3.7 trillion over the 2009-2019 period. Finally, we added the extra debt-service costs caused by the Bush-era tax cuts, amounting to more than $200 billion through 2008 and another $1.7 trillion over the 2009-2019 period — nearly $330 billion in 2019 alone.”
See? They didn’t make-up the numbers. All you had to do was click on the link to their study and it would have explained it all. You also could have done a back-of-the-envelope sanity check to see that the CBPP numbers were in the ballpark. The Bush tax cuts permanently reduced income tax receipts by ~2%-3% percent of GDP. Before the Bush tax cuts were implemented income taxes averaged ~10% of GDP. The FY2008 Bush OMB tables show that income taxes plunged to about 7%-8% of GDP. All you had to do was add up 2%-3% of GDP from 2001 thru 2019, plus debt servicing costs and you get pretty close to the CBPP numbers.