Recent reports ([WSJ RTE] [Bloomberg] [The Hill]) indicate that under consideration as one approach to curtailing entitlement spending growth is to resort to Chained CPI, as opposed to the current official CPI series, which is based on a quasi-Laspeyres formula.
An Econbrowser discussion of the Chained CPI is here, while a recent comparison of inflation rates measured using different indices is here. I reproduce figure 2 from that post.

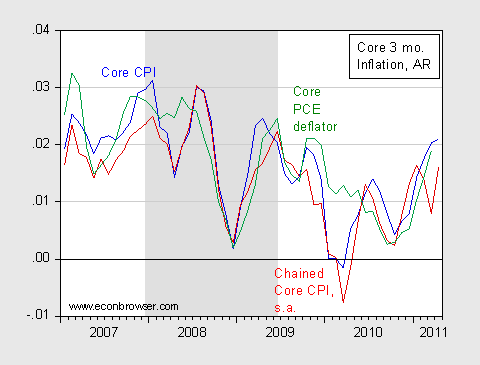
Figure 2: Three month annualized inflation in Core CPI (blue), Chained Core CPI, seasonally adjusted (red), and Core personal consumption expenditure deflator (green). Chained Core CPI not-seasonally-adjusted series seasonally adjusted (on log values) using EViews X-12 routine (additive) over 1999M12-2011M04 period. NBER defined recession dates shaded gray. Source: BLS and BEA via FREDII, BLS, NBER and author’s calculations.
Note that I seasonally adjusted the chained seasonally unadjusted series I could find; hence, the plotted series is not the BLS’s seasonally adjusted series. For purposes of thinking about trends in the level of one series versus another, the seasonal adjustment factor should not be of central importance.
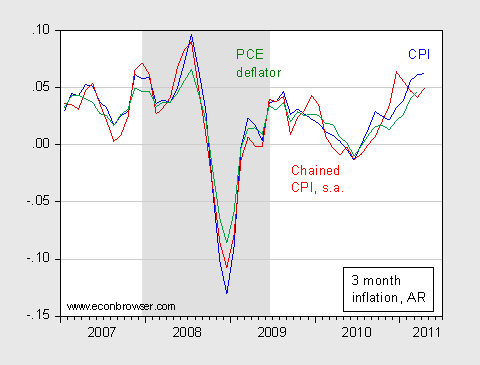
Update, 11:30am Pacific: Reader Ed is exercised about the plotting of the core price indices. Hence, I plot the 3 month annualized inflation rates for CPI-all, the Chained CPI and personal consumption expenditure deflator.

Figure 1: Three month annualized inflation rates for CPI-all (blue), the Chained CPI (red), and personal consumption expenditure deflator (green). Chained CPI not-seasonally-adjusted series seasonally adjusted (on log values) using EViews X-12 routine (additive) over 1999M12-2011M04 period. NBER defined recession dates shaded gray. Source: BLS and BEA via FREDII, BLS, NBER and author’s calculations.
I noticed the word “core” in all of the above plots and comments. Core inflation is a farce in that it has reduced variability due avoiding the variability associated with food and energy. However, most everyone I know needs food and energy. If we are truly interested in an economics that concerns people not corporations then we need to look at actual inflation. My personal opinion is that anyone who comments on core inflation should have to go with out food or energy.
Ed, you don’t understand purpose of “core” inflation, which is to forecast future inflation.
Anyway, what do you want the government to do about inflation? The government only has one tool for controlling inflation — throwing people out of work by increasing interest rates. There’s been an increase in the cost of food and energy, so you want the government to throw people out of work? Awesome plan.
Pretty dismal economic news this morning:
Nonfarm payrolls rose only 18,000; unemployment to 9.2%. This is consistent with our expectations for an oil shock. Given shock level prices from February and a 30-180 days transmission period, we would expect an economic impact with 100 days or so–so about May. And that’s what the numbers show.
Barring a recession, I am skeptical that oil prices will ease materially in H2, and Goldman and some other banks are showing high oil prices for that period. So either the economy tanks now, or probably will later on.
We need some more work done on the pace and path of adaptation to high oil prices. There’s plenty of data, but not much understanding. This issue could use some help from some good economic minds.
Steven Kopits,
You are an excellent economic mind. Might I suggest that you dig a little deeper into what is actually driving oil prices. What you may discover is that the same thing is driving the economy and that oil prices are not a cause but an indicator of economic conditions.
Steven, yes but the report looks as bad as it does mostly because government employment fell by 39k. Non-farm employment was up 57k, not a big number but not a terrible number.
Gents –
There is plenty of disagreement about the impact of oil on the economy. I am among the pessimists–mostly because I see everything from an oil lens. So let’s wait and see. Jim’s usually right about the macro outlook, so I’m prepared to be wrong, but then that requires some re-working of our models, and that in turn is related to pace of adaptation to high oil prices, I think. (That is, economic growth has to be de-coupled from the availability of oil.)
The driver of oil prices is relatively clear: demand is running ahead of supply. The relevant question here is how oil prices can run ahead of the carrying capacity of the consumer countries, which we peg respectively at $85-90 for the US and $100-105 for China. So how can Brent be $118? It shouldn’t be theoretically possible, right? So we tend to attribute this gap to “speculation”.
However, if you believe in price inelasticity of the demand for oil–that people won’t cut consumption even in the face of rising gasoline prices–then you must have prices above the carrying capacity price to induce changed behavior. And the method of reduction in consumption is an oil shock-induced recession. In this model, the “speculators” are the passive result of demand inelasticity preceding an oil shock. And we have numbers to measure all these, so we can actually model quantitatively.
Anyway, I should have something more formal on this in the next couple of weeks, but that’s where the thinking is right now.
Meanwhile, you can take a look at my presentation to Senate Republican staffers last Friday. It should be available on our (the Douglas-Westwood) website on Monday.
Walt
Do you want government to both control inflation and greatly improve the employment numbers? Then resort to a slow, steady, and small increase in base money for inflation, and for employment reduce tax rates until government expenditure finally returns to about 10% GDP.
But I have a feeling you feel more secure with big government telling how to run other’s lives and continue the illusion that they can micromanage macro.
S. Kopits,
How does the 7-8-2011 WSJ front page article, “Canada Has Plenty of Oil, But Does the U.S. Want It? “, fit into the oil supply, demand and price analysis?
Steven Kopits,
I have only done a high level compare of oil price, oil supply, and gold price so I don’t know what the results will be, I do not work with oil statistics, but take a look a compare of these three and see which ones have the most coorelation. Granted coorelation does not mean cause and effect but it should raise questions?
Looks like economic activity increased by the end of June, maybe a sign the recovery from the Japquake has fully gotten underway.
Nobody talks about this, but in a fragile economy, it had a huge effect.
Chain of fools.
Like hedonics and substitution, this is just another gimmick to understate inflation, screw the poor and elderly, and defend the Dirty Fed.
W.C. Varones: Substitution is a gimmick? Thanks for your tightly reasoned intellectual defense of Leontiev indifference curves.
Menzie,
Your Liontiev curves are quite impressive, but most non-economists would find it absurd to say that if the price of hamburger doubles, there is no inflation because everyone has to start eating Alpo instead.
When economists become so infatuated with their models and formulas that they start failing to describe the real world, they have lost the entire point of their profession.
W.C. Varones: That … is … not … what … a … chain weighted index does. Please learn how to use a summation operator and to calculate growth rates.
Menzie,
That … was … not … about … chain weighted indexes. That was in response to your comment, “Substitution is a gimmick?”
Please learn how to follow a simple back-and-forth discussion.
From a consumer’s point of view it looks like..if one chooses to buy a less expensive item in the “basket” in order to save for something else, it will lower the CPI and the consumer’s reward for trying to save in one part of the buget is to recieve less money the following year. We are “balancing the budget on the backs of the poor” again. There is plenty of revenue in this country. Let’s get corporations to pay their fair share of taxes for a start. It is wrong for big corporations to pay no taxes and have big profits. Yes, I am a shareholder.
Look at this for 1999 to 2000 0.8 percentage points. Even if the difference is 0.2 use you calculator and take .02 lower year over year and see how this “supposedly small” difference become large.
Questions about the Chained Consumer Price Index for All Urban Consumers
http://www.bls.gov/cpi/cpisupqa.htm
“10. Is the difference between the CPI-U and the C-CPI-U expected to be fairly stable over time?
Earlier evidence suggested that the difference between the CPI-U and the C-CPI-U would be around 0.2 percent a year. For the period December 1999 to December 2000, however, the difference was 0.8 percentage point. There were a number of reasons for the larger difference, including the relative age of the weights in the CPI-U, and the increased variation in price movements across CPI item categories, causing the divergence between the CPI-U and C-CPI-U to grow. In each of the last four years (including 2004, for which the C-CPI-U values are not final), the difference in December-to-December changes was 0.3 or 0.4 percentage point.”
Please not the quote was from question 7./ at the link providing.
Also in the graph (Figure 1) above the break down if for each 3 month period.
If the C-CPI-C (chained CPI) is used it would be for a year average.
There is also discussion about taking 2 years to have the actual C-CPU-C corrections in place and the official inflator produced.
This is bad business, hiding cuts for the future in going to the Chained inflator even when the one we use today is TOTALY not measuring the inflation of basic living necessities for the elderly.
If you are a businessman leasing a building to a tenant for 30 years would you agree to use the C-CPU-U? I would not!