I was in Washington DC last week, arriving right after the earthquake and getting out of town just before Irene, to attend a conference on commodity markets at the Commodity Futures Trading Commission. Here are some of the remarks I made at the conference on the role of speculation and fundamentals in recent oil price movements.
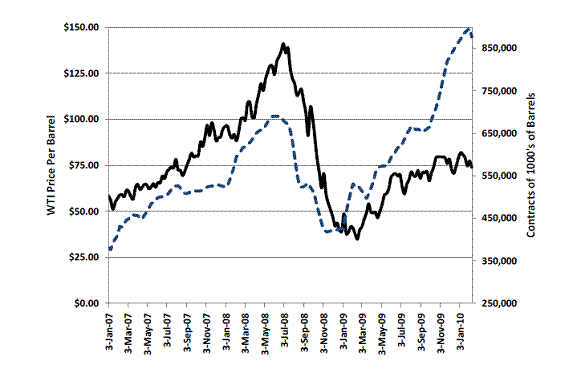 |
The diagram above displays the relation between crude oil prices (solid line) and one estimate (dashed line) of the total number of crude oil futures contracts held by funds that are trying to replicate the Goldman Sachs Commodity Index or the separate Dow Jones-AIG index. One of the issues discussed at the conference was some of the problems associated with these estimates of commodity index fund investments.
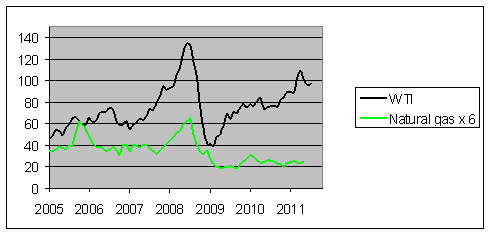
But a separate issue I wanted to raise is that someone following such an investment strategy was buying not just crude oil contracts, but a variety of other commodity futures as well. For example, a fund following either index would have a long position in natural gas futures. The graph below compares the price of crude oil with the price of natural gas. Although these once sold for about the same price per Btu, they now differ by a factor of 4. Why hasn’t index fund buying pushed up the price of natural gas along with crude oil? The answer is obvious to all of us. The surge in natural gas production within the United States has put irresistible downward pressure on the price of natural gas, a reality that completely swamps any purported effect that commodity index buying could conceivably have.
 |
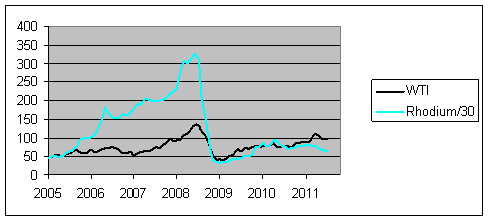
Here’s another example some people like to give, comparing the price of crude oil with that of rhodium, with the latter scaled so that the two prices were comparable in 2005. The price of rhodium shot up spectacularly relative to crude oil over the next few years. That, too, had nothing to do with index fund investment buying. Neither GSCI nor DJ-AIG includes this commodity– in fact, to my knowledge it is impossible to buy a futures contract in rhodium.
 |
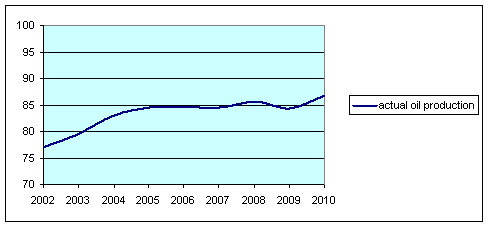
These two examples highlight that fundamentals of supply and demand can be far more important than any effects of speculative purchases in futures markets. Although it’s a well known story, it’s worth restating the contribution that those fundamentals have made for the oil market in particular. The graph below plots global oil production since 2002. A key fact that brought us where we are today is that global oil production basically stagnated between 2005 and 2009.
 |
But over these same 5 years, world real GDP increased by 17.2% logarithmically [that is, ln[y2009] – ln[y2004] = 0.172 for yt world real GDP in year t]. If there had not been significant increases in the price of oil over this period, we would have expected to see a big increase in the quantity demanded globally.
How big an increase that would have been depends on the income elasticity of oil demand. Academic studies suggest we might use an income elasticity of around 0.5 to describe the U.S. today but a value closer to 1.0 for emerging economies. The emerging economies account for about 70% of the growth in world petroleum consumption since 1998, so I would be inclined to use a value closer to 1 than to 0.5 if we want to talk about total world demand. The illustrative calculations below assume a world income elasticity of 0.75, which implies that, if the price of oil had not risen, the 17.2% increase in world income would have been expected to lead to a (0.75)(17.2) = 12.9% increase in oil consumption. The red line in the graph below plots the level of oil demand predicted on the basis of the observed world GDP for each year since 2002 if one uses this income elasticity of 0.75 and if the price of oil had not changed over this period. Steve Kopits has used a similar graph, derived from a different set of assumptions, to make the same point. The recession in 2009 would have been expected to produce a small dip in consumption that year, but despite the recession, oil production today is about 10 million barrels a day below the value that I would have expected to be associated with a stable oil price.
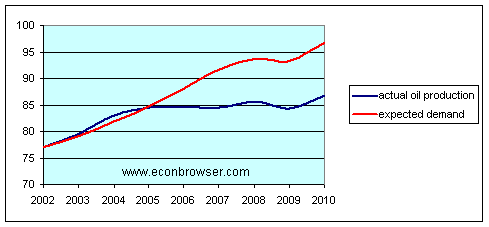 |
The reason we’re not consuming 97 mb/d is because the price of oil didn’t stay constant. Let’s next ask how much the price would have to go up to keep the quantity demanded equal to the amount currently being produced. The answer to this question depends on the price elasticity of oil demand, a number for which there is a range of estimates. For illustration, if we assume a price elasticity of 0.1 and if we treat the base price in 2005 as $50/barrel (in 2010 dollars), then in order to reduce the quantity of oil demanded by 10.79% [this is the logarithmic gap between the black and red curves in the graph above for 2010], the price would have had to go up to $147:
(50)exp(0.1079/0.1) = 147
In other words, if you believed that an income elasticity of 0.75 and price elasticity of 0.1 were the right numbers to apply to this 5-year period, you’d think we should be paying about $147/barrel today.
Now such calculations are extremely sensitive to the price elasticity that you assume. If for example you thought that demand was twice as sensitive to price as assumed above (that is, the price elasticity should be 0.2 instead of 0.1), then you’d expect the price of oil today to be more like $86/barrel:
(50)exp(0.1079/0.2) = 86
Or you might believe that the short-run price elasticity is about 0.1, but given more time to make adjustments such as the kind of cars we drive, the longer-run elasticity is closer to 0.2. In that case, you would have expected to see the price temporarily go up to $147/barrel, but by now to have fallen back to about $86. Which, it turns out, is exactly what happened.
I do not mean to defend these rough calculations as the literal description of how the world works. But I do think they illustrate that there is really nothing all that mysterious about the behavior of oil prices over the last five years.
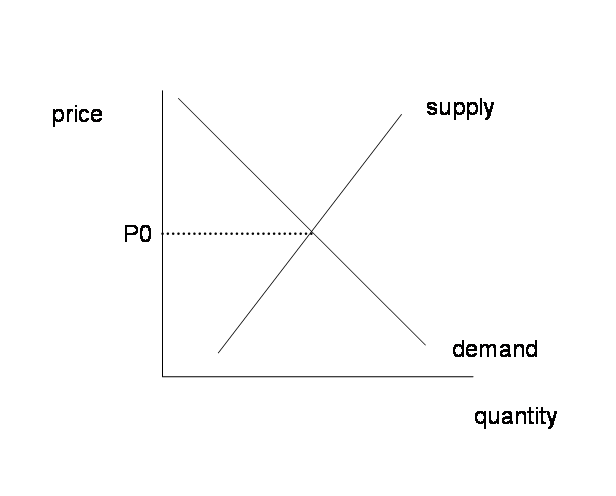
If you want to repeat these calculations with your own favorite parameters, be my guest. If, for example, you believe the price elasticity is more like 0.25, then you’d conclude the price of oil today should only be $77, and you could claim that any current excess over that number must represent the effects of speculation. I’m not going to try to talk you out of such a view, but instead would invite you to answer Paul Krugman’s question in reference to the diagram below. The horizontal axis measures the number of barrels of oil physically produced or physically consumed. Assume whatever you like about income and price elasticities to derive the value P0 that you maintain is the price that would be justified by the true underlying fundamentals, whatever you conceive that number to be.
Now, if you further maintain that financialization of futures markets has caused the dollar price of a physical barrel of oil to be some value P1 higher than P0, that higher price should mean that quantity demanded is lower than it would have been at a price of P0. Where, then, is the extra oil going? Or, to put it another way, if you believe that we’re currently in balance at a price of P1, how could we still have enough to satisfy the extra demand that would arise if the price fell to P0?
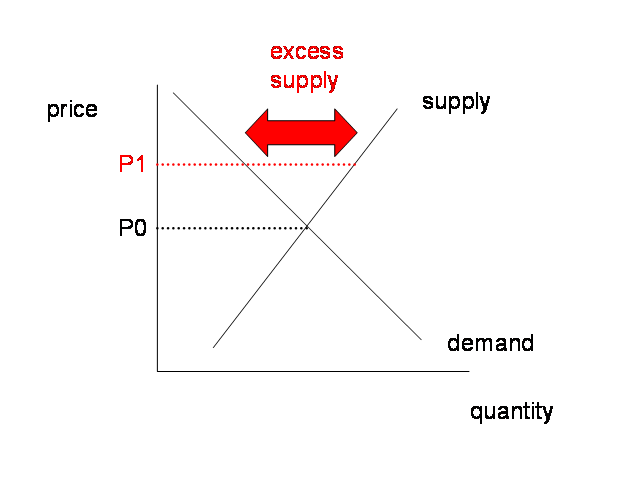
Granted, if supply and demand are relatively insensitive to price over the short run (so that both curves above are very steep), the price could be off for some time before there is much evidence of inventories piling up or being drawn down. In this respect, it is conceivable to me that speculation could have some real effects. But the conditions under which a theory of commodity financialization could essentially ignore fundamentals– namely, the assumption of a very low price elasticity of demand– are precisely the conditions under which a fundamentals-based interpretation would say that what we have just experienced makes perfect sense.
Although I remain open to evidence on a possible short-run contribution speculation may have had, one aspect of the debate over this issue worries me. The plots above of oil production over time in my mind highlight what has been a significant economic challenge over the last few years and very possibly an even bigger challenge in the years ahead. I would like to see more consensus on what seems to me to be a very clear statement of fact, which is, stagnating global production is by far the most important reason for a rising price of oil.
Insofar as discussion of commodity futures speculation causes some people to ignore this critical reality, I fear that it may be doing us a significant disservice.
I’d be interested in the timing of price and growth changes. And whether price changes lead growth.
If this is the case, the view that speculation was driving prices in the short term could cause producers to be weary of increasing production. Also, the rise of revenue/profit dis-associating with production increases and efficiency gains doesn’t create great incentive for improvement or expansion (better to wait for prices to rise, unless there is adequate competition).
ah yes, “peak oil” bummer eh
and now I know I’m dying, I’ve left no living heirs
nobody is alive to know there’s not a soul who cares
there’s only me so damned hungry I’m gnawing at the trees
there’s no-one left to kill and eat oh God please help me please
I can still rememeber…
pop
That is a very good argument that speculation is a red herring. The reality is that oil production is flat.
The question is what to do about it. Some say “Drill, baby, drill.” Others say “Innovate, baby, innovate.”
Alternative energy (and conservation) is a better solution than more of the same in which oil companies create greater environmental and climatic damage as they exploit ever more costly and inefficient oil sources.
“..a very clear statement of fact, which is, stagnating global production is by far the most important reason for a rising price of oil.”
How can U.S. policy reduce the income elasticity of demand for oil and increase the price elasticity?
Jim,
Just wanted to say this is a superb post. Explains the issues clearly and is written at just the right level of complexity for an interested lay person to understand.
Following is a sketch of Global Net Exports* (GNE) and Available Net Exports** (ANE) versus annual US oil prices:
http://i1095.photobucket.com/albums/i475/westexas/GNEANE.jpg
GNE have fell by about three mbpd from 2005 to 2010, while ANE fell by about five mbpd from 2005 to 2010 (an average volumetric rate of decline of one mbpd per year).
So far, the data show that developed countries like the US are being forced to take a declining share of a falling volume of GNE.
*GNE = net oil exports from top 33 net oil exporters in 2005, 99%+ of total net exports, BP + minor EIA data
**ANE = GNE less Chindia’s combined net oil imports
Jeffrey, what producers are consuming more? Just wondering if the gulf war may have been a factor in the increased consumption. When I was in Kuwait in 2006, infrastructure and building were huge, they said little was done before because no one wanted to build something that may be destroyed or stolen. I believe it was much the same throughout the region. Probably even Iran.
JDH I’m assuming that, for pedagogical purposes, in your example you are treating the 0.75 income elasticity as a global average. But my understanding is that this global average masks some important differences. The expectation is that for high income countries the income elasticity is likely well below 0.75 and falling; whereas in the case of developing countries the elasticity could be greater than 1.00.
As a matter of public policy the elasticity we should be most worried about is the elasticity of substitution. Energy conservation is great and I’m all for it, but energy conservation without a flatter marginal rate of technical substitution does nothing to insulate us from future supply shocks. In fact, it likely makes future supply shocks worse because demand becomes even less elastic.
Prof. Hamilton, thanks for an excellent, helpful, & lucid post.
Your analysis is lacking in one major respect: how do suppliers in each of the respective commodities typically do their pricing? Where do they look to for guidance? Surely you cannot assume they are the same for all commodities? It’s an undeniable fact that oil producers are looking to the futures market for guidance, and when you understand how the futures market for crude operates(michael masters’ argument) its not hard to understand why it is that the price of crude and the rush for long positions being well correlated is no coincidence.
Re: aaron
Following are what we respectively show for 2005 and 2010 production, consumption and net export numbers for the top 33 net oil exporters (mbpd, total petroleum liquids):
2005:
62.23 – 16.76 = 45.47
2010:
61.86 – 19.22 = 42.64
The single biggest contributor to increased consumption among the oil exporting countries was of course Saudi Arabia (no surprise given large energy consumption subsidies). Their consumption increased from 2.0 mbpd in 2005 to 2.8 mbpd in 2010.
Here is the key problem: Given an ongoing production decline in an oil exporting country, unless they cut their consumption at the same rate as, or at a rate faster than, the rate of decline in production, the resulting net export decline rate will exceed the production decline rate AND the net export decline rate will accelerate with time.
For more info regarding net export declines, do a Google Search for: Peak Oil Versus Peak Exports.
IMO, the ongoing decline in GNE (Global Net Exports) represent the biggest problem, by far, facing the developed oil importing countries. But hardly anyone is aware that global total petroleum liquids production has been flat at between 81 and 82 mbpd since 2005 (except for 2009), and an even smaller number of people are aware of the global net export situation.
As noted above, when we subtract out Chindia’s combined net oil imports to get Available Net Exports (ANE), we find that ANE dropped at an average rate of one mbpd per year for the past five years. At Chindia’s current rate of increase in their net oil imports as a percentage of GNE, Chindia would consume 100% of GNE in about 20 years.
JDH wrote:
A key fact that brought us where we are today is that global oil production basically stagnated between 2005 and 2009.
But over these same 5 years, world real GDP increased by 17.2%
Professor,
This seems to be contrary to your position that the price affects GDP. You say that production was held down by price increases, but it doesn’t make sense to me that real production would increase but oil production would remain the same. How can GDP increase as the price of oil increases and production remains stagnant?
2slugs! You made an intersting and useful comment!
I’m a big fan of simplicity and efficiency, but we forget that without excess capacity we get lots of risk.
actually, what people often totally ignore is the fact that:
* futures and derivatives are a zero sum game. for every long there is a short position. focusing on the “long position” of “speculators” ignores the fact that – somewhere there is a short. Who’s short? well, if hedge funds are long usually producers are short. BP, Glencore, etc have large trading shops (from industry experience). who do you think has better information about production – BP and Glencore, or a hedge fund? yep me too.
* financialization actually accelerates the process of developing new commodities fields. when a (usually small) company needs to develop and needs a loan, not having the cash on hand, banks like to lend against stable revenues& margins. SO the company offloads (hedges) the commodities risk to someone else and locks in the margin while they develop the field (true for all commodities not just energy). BP, exxon, Southwest airlines… all hedge their expected purchases and sales, with “speculators” in the middle. bigger financial market = more liquidity for hedging and more efficiency. and over time, more projects get developed because the uncertainty premium is reduced.
i know you know all this. In the short term, supply is inelastic – what causes volatility is the fact the trades get crowded. hedge funds are contrarian in theory, but a herd of sheep in practice. they all read the same goldman and barcap commodities reports, go to the same conferences, discuss trends…. and so on. rush one way when they see it going up… then they all rush the other way when the market gets ahead of fundamentals.
so if there is market volatility? baaaaaaaaa. sure, blame the sheep. but they can’t help what they are. I did not hear anyone complaining in late 2008/early2009 when gas was under 2.25 because the sheep were all running the other way.
Excellent post. Lots of great comments.
In mature economies, per capita oil consumption can remain stable without harm to the economy. So population growth is the key driver. The US still has it, primarily from immigration. Europe and Japan mostly don’t. So per capita income elasticity in the developed world is around zero. Allowing for 1% population growth in the US, income elasticity (using national GDP), might be around .25-.40 or so.
In the emerging economies, notably for those on the “S” curve of motorization, we might expect 1.1-1.2 for income elasticity. Last year, China’s figure was 1.05 even in the face of rapidly rising oil prices.
Increased vehicle mileage standards would increase observed income elasticity, albeit at a potential greater loss of welfare. So the question is whether Washington in its wisdom can make better decisions for 300 million people than they can for themselves. Maybe, but it’s a pretty high standard. Certainly the government could provide more information about the likely course of oil and gasoline prices. The EIA has historically been less than fully helpful in this regard.
The problem with price elasticity is that oil consumption is linked to fixed cost structures: vehicles, houses and jobs. So historically we tend to try to hold on to consumption levels and reduction consumption really only during recessions.
There are two historical exceptions: the period of recovery 1975-1979, and between the 1980 and 1983 recessions. Both these were periods of grinding adjustment, and in both cases, oil prices were falling for most of the period. Both periods ended in recessions; and indeed, it was a difficult time throughout the period–in some ways not so unlike today.
Unlike the post-’75 and ’79 periods, oil prices were again rising into April, and such rises are associated with oil shocks and recessions. I think we have pretty good circumstantial evidence to argue an oil price-induced slowdown. Whether it will lead to outright recession remains to be seen.
Expect the pressure to continue. Per capita income elasticity of oil consumption fell to below zero for the advanced economies after 1979–motorization was complete. In addition, high prices brought vast supplies on line–an increase of 7 mbpd in just the four years to 1983. So after 1979, surging supply was meeting stagnant demand.
It’s just the opposite now. At present, if we discount Saudi spare capacity (even if just for political reasons), then productive capacity is up just 3 mbpd in the last seven years, and much of that is not crude oil at all.
At the same time, China’s demand is just now getting into high gear, and pro forma, China’s demand alone could increase by 2-3 mbpd in at least a few of the years late in this decade or early in the next.
So it’s not 1979 any more, either on the demand or supply side.
Ricardo,
My 2¢ worth:
I think that many (most?) OECD countries are borrowing to in effect, try to keep their consumption up and their economies on some kind of growth path. My “Thelma & Louise” metaphor follows below. And of course, oil exporting countries are doing pretty well.
One of the additional characteristics of net export declines is that they tend to be “front-end” loaded, with the bulk of post-peak Cumulative Net Exports (CNE) being shipped early in the decline phase. Based on extrapolating the ratio of consumption to production for the top 33 net oil exporters, a rough estimate is that in 2020, about 10 years hence, global importers may have already consumed about half of the total global supply of post-2005 CNE.
In other words, by definition, the post-2005 global net export fuel tank (post-2005 CNE) was full at the end of 2005. That fuel tank may be half empty by the end of 2020.
The OECD “Thelma & Louise” Race to the Edge of the Cliff
“Thelma and Louise” is an American movie that ends with the two main characters committing suicide by driving off the edge of a cliff. I’ve often thought that this cinematic moment is an appropriate symbol for the actions of many developed OECD countries that are in effect borrowing money to maintain or increase current consumption. The central problem with this approach is that as my frequent co-author, Samuel Foucher, and I have repeatedly discussed, the supply of global net oil exports has been flat to declining since 2005, with “Chindia” so far consuming an ever greater share of what is (net) exported globally. Chindia’s combined net oil imports, as a percentage of global net exports, rose from 11.2% in 2005 to 17.6% in 2010.
At precisely the point in time that developed countries should be taking steps to discourage consumption, many OECD countries, especially the US, are doing the exact opposite, by effectively encouraging consumption. Therefore, the actions by many OECD countries aimed at encouraging consumption in the face of declining available global net oil exports can be seen as the OECD “Thelma & Louise” Race to the Edge of the Cliff. I suppose that the “winner” could be viewed as the first country that can no longer borrow enough money, at affordable rates, to maintain their current lifestyle. So, based on this metric, Greece would appear to be currently in the lead, with many other countries not far behind them.
You would appear to be arguing for austerity, Jeffrey.
2slugs,
There is still some benefit to our conservation, if we can push our consumption down (long run), it shift to more elastic buyers and reduces overall risk.
On Jesuits methods,a question answering a question.
If there are no speculations driving prices in the commodities markets why:
Are financial corporations losing money on the same markets?
Why do they lose money on the downside when demand is slowed by cyclical downturn?
http://www.gao.gov/new.items/d11529.pdf
In the good time proprietary trading is not so much rewarding but very punitive in downtrend economic cycles.Speculation exists, shown to be quiet hopeless for the overal contribution to the banks P&L In light of their cumulative results.
As reported the GAO analysis is confined to 6 largest banks and to their own capital risk,most of banks maintain commodities management on behalf of private customers and comodities funds.
From memory and Bloomberg may help,comodities funds went in amount gradually up from 2004 to 2007 to reach a cumulative amount of 800 billion USD worlwide.
“GAO did not analyze data on broader proprietary trading activity but
analyzed data on stand-alone proprietary-trading desks at the six largest U.S.
bank holding companies from June 2006 through December 2010. Compared to
these firms’ overall revenues, their stand-alone proprietary trading generally
produced small revenues in most quarters and some larger losses during the
financial crisis. In 13 quarters during this period, stand-alone proprietary trading
produced revenues of $15.6 billion—3.1 percent or less of the firms’ combined
quarterly revenues from all activities. But in five quarters during the financial
crisis, these firms lost a combined $15.8 billion from stand-alone proprietary
trading—resulting in an overall loss from such activities over the 4.5 year period
of about $221 million. However, one of the six firms was responsible for both the
largest quarterly revenue at any single firm of $1.2 billion and two of the largest
single-firm quarterly losses of $8.7 billion and $1.9 billion.”
Why are above linear homogeneous functions not answering the puzzle
Econbrowser “Brent-WTI spread”
The puzzling differential between the price of oil in different markets seems to be persisting.
For most of the last decade, there was very little difference between the price of West Texas Intermediate traded in Cushing, Oklahoma and that for North Sea Brent in Europe. But a $10-$15 spread between the two developed at the end of January and has remained ever since.
Why are strategic reserves acting as buffer not to cater in prices but in volume?
http://crudeoilpeak.info/strategic-oil-reserve
Ricardo: (1) I have never claimed that it is impossible for the economy to grow if oil consumption does not. Instead, the framework I would use to discuss growth with constant oil supply is exactly the one used here that implies a rising price of oil. (2) Note that the numbers reported above refer to global GDP, which grew 17.2% between 2004 and 2009. For comparison, U.S. real GDP increased by 3.7% over this same period. I have always maintained that the U.S. economy is more vulnerable than other countries due to the reliance of U.S. auto manufacturers on less fuel-efficient vehicles. (3) My view is that the response of U.S. GDP to oil prices is nonlinear. Slow and predictable price increases we can grow through, but large rapid spikes have historically been quite disruptive.
“I would like to see more consensus on what seems to me to be a very clear statement of fact, which is, stagnating global production is by far the most important reason for a rising price of oil.”
A strange statement. Seems no truer than to say that growth in demand is the most important reason.
Thanks Professor for the reply. I missed that the 17.2% increase was global but I should have realized that. US GDP has been low and is declining. My mistake.
I understand and accept your comments 1. and 3. but I feel my question still remains at a global level for 2. If anything it is even more amazing because with the US being the largest trading block but with such anemic GDP growth, the rest of the world is booming, yet oil production is flat. It seems even more unusual for higher oil prices to not limit world growth. It seems the oil prices are reacting to the same economic factors as GDP rather than influencing them.
Steven,
If I could dictate policy, I would implement an energy consumption tax, at the retail level, offset by abolishing the highly regressive Payroll Tax, but that would force us to acknowledge resource limits, which politicians don’t seem inclined to do.
Instead, most OECD countries are borrowing money, in effect trying to maintain consumption or encourage greater consumption.
On a personal level, following is my suggested “ELP Plan,” which I wrote in April, 2007:
http://www.aspousa.org/index.php/2011/08/the-elp-plan-economize-localize-produce/
In what sense is a gasoline tax not regressive? It’s considerably more regressive than a payroll tax.
Banks were short oil before the 2008 crash
http://www.upstreamonline.com/live/article275331.ece
Shales, shales everywhere
http://www.platts.com/weblog/oilblog/2011/08/29/new_frontiers_t_2.html
Steven,
But if an energy consumption tax is offset by abolishing the Payroll Tax, we would have a carrot & stick approach to energy consumption. One could materially lower one’s taxes by cutting energy consumption.
In any case, as noted above, policies which recognize that we have finite energy resources don’t seem likely to be implemented.
Steven,
Regarding the shale plays, and increased efforts in mature Lower 48 basins, note that so far total US crude oil production has been between 5.4 and 5.6 mbpd since the fourth quarter of 2009 (versus a 1970 peak of 9.6 mbpd).
And it’s useful to consider some actual production case histories in shale plays. About three years ago, Chesapeake was projecting late 2011 natural gas production of 250 MMCFPD (million cubic feet per day) from their 18,000 acre DFW Airport lease in the Barnett Shale. Based on the current rate of decline in production, it appears that they will be down to about 25 MMCFPD by the end of 2011, one tenth of their original projection.
Ricardo, here’s how an economy can grow without increasing energy usage: work more, use more capital, and/or increase productivity. Taking typical estimates, set productivity growth at 1 percent, add 64% of the growth rate of labor hours, 32% of the growth rate of the capital stock, and 4% of the growth rate of energy and raw material usage in production. Voila, output growth. For more on the topic, JDH could provide his favorite readings on production functions.
My biggest reaction to the article is to look at Krugman’s diagram and say, quite simply, that it assumes that the demand and supply curves are linear.
This, I suggest, is simply wrong. The elasticity of oil is, in fact, highly dependent on price level, and is not close to linear. Consumption and oil prices is a VERY dynamic process, which is why the R squared on many of the models is so low – there are too many omitted variables for the line to fit very well.
The author previously, for example, presented a model for oil prices and GDP. It was great work – but the R squared was pretty low (.22).
Comparison of the movement in oil and natural gas is also revealing. The author suggests that the divergence has to do with the increase in the supply of natural gas – and I am sure that this is true.
But there is also far more transparency into the supply of natural gas than oil. A critical variable in the price of oil is the estimated supply – and there is substantial uncertainty in how much the Saudi’s and others have left. The Saudi’s, the Iranians and other producers don’t file 10k’s.
It would be interesting to try and determine the extent to which the difference in behavior of the oil markets and natural gas markets stem from this difference. It also would be interesting to determine if any of the difference between the WTI price and the Brent Price is a result of the differences in transparency.
Very interesting post, I couldn’t agree more with, particularly in regards to economic academic circles. For example, in the last European Economic Association and Econometric Society in Oslo mainly dedicated to the current financial crisis, there was only a single paper discussing the effect of oil prices in determining the economic recession:
http://www.eea-esem.com/EEA-ESEM/2011/prog/viewpaper.asp?pid=1658
From that point of view, the academic situation is extremely disappointing (except for you, prof. JDH)
However, there were today some interesting posts at the Financial Times – Alphaville which try to explain,
1) why it might make sense for the Fed (or a respective government agent) to intervene in commodities,
2) whether the Fed has indirectly ALREADY intervened and does this explain the mysterious WTI-Brent disconnect.
Here are the posts:
– The Fed’s oil easing
http://ftalphaville.ft.com/blog/2011/08/30/664386/the-feds-oil-easing/
– The Fed’s convenient WTI ‘Cushing’ factor:
http://ftalphaville.ft.com/blog/2011/08/30/664751/the-feds-convenient-wti-cushing-factor/
These posts summarize the idea that many oil consultants have (including myself), that is the FED is perfectly aware of the effects of oil prices and stagnating oil supply, and it is actively acting to stave off price spikes as well as the classical self-fulfilling price spirals which take place in case of oil supply disruptions (like Libyan war, Japan disaster and increase Japanese oil demand, ect).
Even though officially the FED may behave like the mainstream academic economists and downplay the effect of oil shocks, unofficially it is probably much smarter than them and works actively to counter-balance the increasing oil shocks due to the increasing limited supply of cheap oil.
Lowsmoke,
Of course an economy can grow without increasing energy use. Growth has outpaced energy in the US for decades because of efficiency. My point is that the common wisdom that the price of oil drives the economy is simply not true. Oil responds to the same economic conditions as the rest of the economy and the rest of the economy does not relay on the price of oil. Those who would make high oil prices the cause of decline are simply wrong.
But oil is a simple commodity, more simple than most, coming essentially right out of the ground, and so it is more quickly impacted by inflation adn deflation. The value of the dollar has a huge impact on the price of oil, and the value of the dollar can be seen in the price of gold.
flamdem asks: “It also would be interesting to determine if any of the difference between the WTI price and the Brent Price is a result of the differences in transparency.”
Don’t waste your time. The Brent price is a saltwater price and like all oil reaching saltwater is indicative of the price in world markets. WTI reflects the insufficient pipeline capacity from Cushing, Oklahoma to saltwater.
And of course the real reason why tarpits promoters want the Keystone XL pipeline is to get more sludge to refineries with saltwater access in order to take advantage of what the folks in China etc are willing to pay.
Everyone needs to realize that OIL ISN’T TRADED ON THE FUTURES MARKETS. The Futures markets are a glorified auction sale for the risks associated with supply vs price at some future date on a minute by minute basis. Speculators play nothing more than the role of insurance broker for that risk between suppliers and consumers in a down market as well as an up market. While removing them might temper the the price fluctuations in the short term, in the long term we would find ourselves with only the oil that is available at a lesser risk/cost. High fuel is a whole lot better than no fuel. I can’t push my pickup home!
Jeffery,
The economies of the OECD countries are consumer driven. The only way politicians know how to grow them is through unsustainable/debt consumption.
Some “What If” Scenarios
2005 & 2010 Production (P), Consumption (C) and Global Net Export (GNE) numbers for 2005 top 33 net oil exporters (BP + Minor EIA data, total petroleum liquids, mbpd):
P – C = GNE
2005: 62.2 – 16.8 = 45.4
2010: 61.9 – 19.2 = 42.7
Assuming 2005 to 2010 rate of increase in consumption & a 2%/year production decline rate, in 2015 we would see:
2015: 56 – 22 = 34
Available Net Exports (GNE less Chindia’s net imports) fell from about 40 mbpd in 2005 to about 35 mbpd in 2010, i.e., down about one mbpd per year from 2005 to 2010.
Assuming 2005 to 2010 rate of increase in Chindia’s net imports*, and assuming GNE of about 34 mbpd in 2015, in 2015 we would see ANE of about 23 mbpd, down 2.4 mbpd per year from 2010 to 2015.
*Chindia’s net imports in 2005 were 5.1 mbpd, in 2010 7.5. At this rate of increase they would be at 11 mbpd in 2015.
Good post. Keep in mind that a number of emerging countries subsidize and/or put controls on fuel prices, leading the consumers to have lower effective elasticity. Brazil, China, India all distort prices to some degree, shifting the burden of higher oil prices to the state or state-owned enterprises. Thus some of the fastest growing consumers of oil aren’t seeing the real cost.
Re: A. West & Energy Subsidies
Certainly true, and Saudi Arabia is a prime case history, but my primary focus is on the supply of net oil exports, and the math is relentless.
Consider two supply case histories:
An oil exporting country hits peak production, let’s say in the year 2000, and in the year 2000 they were consuming 50% of their production. Their post-peak production decline rate is 5%/year (about what we have seen in the North Sea). For Case #1, their consumption increases at 2.5%/year. For Case #2, they show no increase in consumption.
For Case #1 (increasing consumption), they hit zero net oil exports in nine years, in 2009.
For Case #2 (flat consumption), they hit zero net oil exports in 14 years, in 2014.
In both cases, the net export decline rate exceeds the production decline rate AND the net export decline rate accelerates with time.
Given an ongoing production decline rate in an oil exporting country, unless the country’s rate of change in consumption falls at the same rate, or at a rate faster than, the rate of decline in production, the resulting net export decline rate will exceed the production decline rate and the net export decline rate will accelerate with time.