We know that in the aftermath of combined housing busts, financial crises, and recessions, recoveries are typically modest if not halting, even if the recession is deep. [0] This characterization appears to have held true, with the question now whether we will enter into a new recession, or merely plug along with growth that technically constitutes a recovery, but is not sufficient to close the output gap with appreciable speed.
Business Cycle Indicators
The NBER lists the indicators that are of interest in terms of business cycle dating, as of the latest trough. (The months pertain to the trough dates that mark the last expansion.)
- Macroeconomic Advisers’ monthly GDP (June)
- The Stock-Watson index of monthly GDP (June)
- Their index of monthly GDI (July)
- An average of their two indexes of monthly GDP and GDI (June)
- Real manufacturing and trade sales (June)
- Index of Industrial Production (June)
- Real personal income less transfers (October)
- Aggregate hours of work in the total economy (October)
- Payroll survey employment (December)
- Household survey employment (December)
In the following two figures, I depict the series in bullet points 5-10.
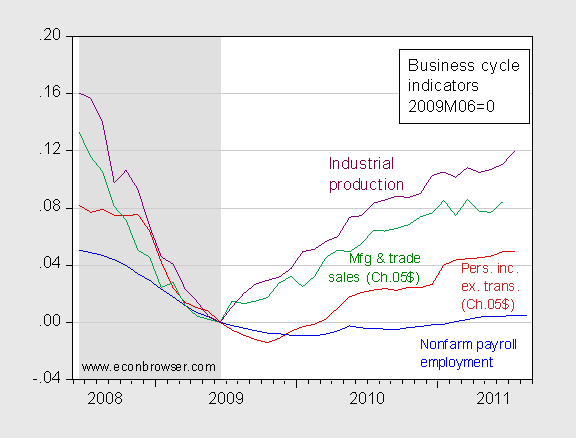
Figure 1: Log nonfarm payroll employment (blue), real personal income excluding transfers (red), real manufacturing and trade sales (green), and industrial production (purple), all rescaled to 0 at 2009M06. NBER defined recession dates shaded gray. Source: BLS, BEA, and Federal Reserve Board via St. Louis Fed FRED, NBER, and author’s calculations.
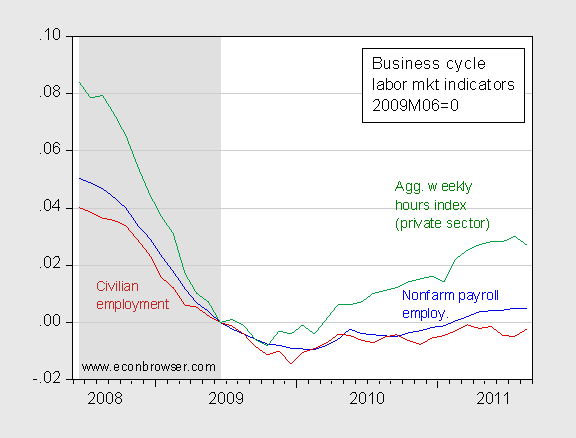
Figure 2: Log nonfarm payroll employment (blue), civilian employment (red), aggregate weekly hours in private sector for production and nonsupervisory workers (green), all rescaled to 0 at 2009M06. NBER defined recession dates shaded gray. Source: BLS via St. Louis Fed FRED, NBER, and author’s calculations.
The flattening out of nonfarm payroll (NFP) employment received most attention, but civilian employment as measured by the household survey has also essentially trended sideways since April. The most troubling aspect of Figure 2 is the decline in aggregate weekly hours in August.
Since I do not have access to the Stock and Watson monthly GDP and GDI series (bullet points 2 and 3), I plot the Macroeconomic Advisers series (bullet point 1) and the e-forecasting monthly GDP series.
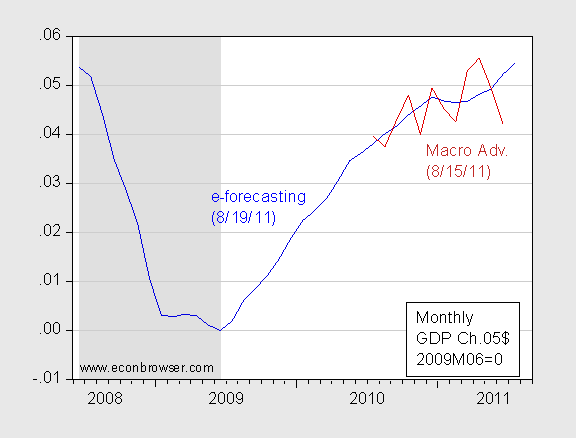
Figure 3: Log GDP from e-forecasting (blue), from Macroeconomic Advisers (red), all rescaled to 0 at 2009M06 (MA series rescaled to e-forecasting value at 2009M06). NBER defined recession dates shaded gray. Source: e-forecasting, Macroeconomic Advisers, NBER, and author’s calculations.
The MA series highlights the concerns of a slowdown. The e-forecasting series is less alarming. However, like almost all macroeconomic series, perhaps even more so, these are estimates, subject to later revision. That is why the NBER business cycle dating committee (BCDC) waits so long after a likely trough date to make its decisions.
As Jim mentioned the other day, Gross Domestic Income (GDI) can sometimes be more reliable than the expenditure based approach used in calculating the GDP series. This perspective has a long-standing history. See for instance CEA (2000) (p. 79).
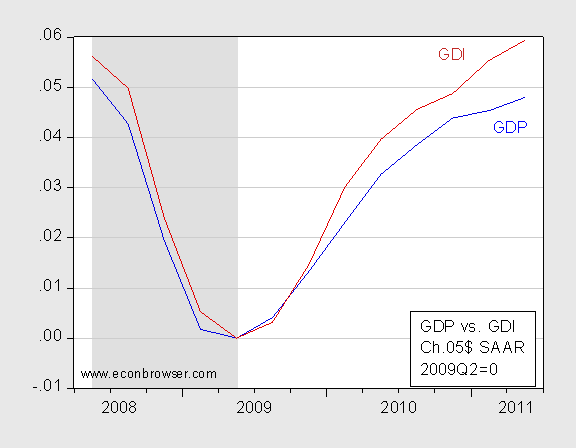
Figure 4: Log real GDP (blue), and log Gross Domestic Income deflated by GDP deflator (red), all rescaled to 0 at 2009Q2. NBER defined recession dates shaded gray. Source: BEA, 2011Q2 2nd release, NBER and author’s calculations.
The rebound from 2009Q2 is slightly more marked using real GDI – by slightly more than a percentage point. However, both series are probably measured with substantial error, so the NBER BCDC considers the average of the two series. In that case, the picture is not appreciably improved.
The Labor Market, Reconsidered
Other labor market indicators exhibit a similar mixed nature.
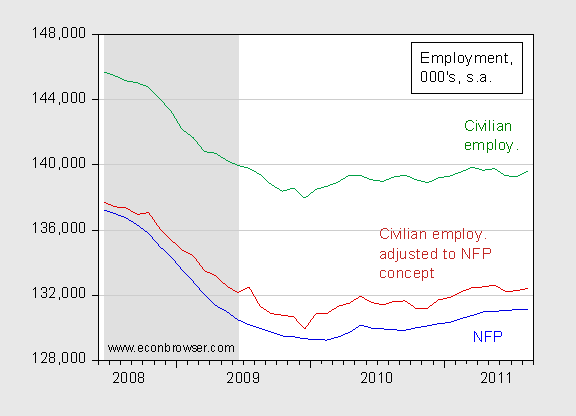
Figure 5: Log nonfarm payroll employment (blue), civilian employment adjusted to NFP concept (red), and civilian employment (green), all in 000’s, seasonally adjusted. NBER defined recession dates shaded gray. Source: BLS via St. Louis Fed FRED, BLS and NBER.
The household survey based series – either the official civilian employment, or the research series adjusted to conform to the nonfarm payroll concept — rose in August. Nonetheless, the level is roughly the same as it was earlier in the year. One interesting fact is the adjusted series is 1.3 million higher than the official NFP series. (Of course, the household series exhibits a lot more variability than the establishment, so I think one should still put greater weight on the latter generally — although the benchmark revision will likely have a big level impact.)
That point regarding revisions gives rise to my tempered assessment: retrospective indicators do not indicate a new recession, but we know that most of the series that I have cited above will be revised. In other words, I’m not going state unequivocally we are not in a recession (i.e., I am not going to “pull a Lazear”).
Policy Implications
Even if the economy continues to grow, the pace of GDP expansion is still far below that necessary to shrink the output gap quickly.
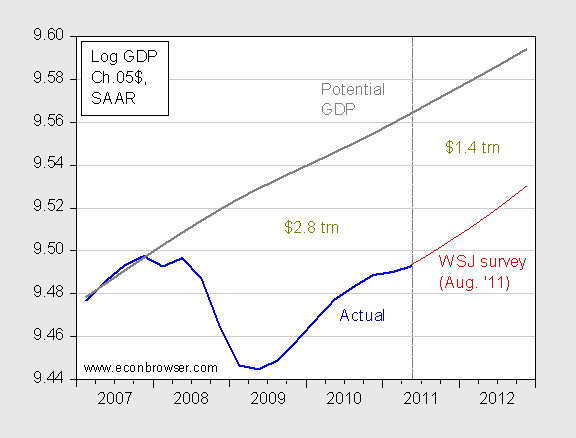
Figure 6: Log GDP (blue), potential GDP (gray) and forecasted GDP according to mean of August WSJ survey (red), all in Ch.2005$, SAAR. Cumulative losses 2008Q1 up to 2011Q2, and implied losses 2011Q3 up to 2012Q4. Source: BEA, CBO, WSJ, author’s calculations.
As of 2011Q2, the cumulative output loss associated with the $2.8 trillion (in Ch.2005$). Using the August 2011 WSJ survey mean forecast, by 2012Q4, an incremental $1.4 trillion cumulative loss is incurred.
Given the deterioration in the economic outlook, I think it absolutely imperative that additional measures be implemented to sustain economic growth. Jim provided some monetary/fiscal options here.
My own suggestions, ignoring the political constraints imposed by those Republicans who have suddenly changed their views regarding optimal policies [1], include an employment tax credit [2], extension of the payroll tax reduction [3], resumption of transfers to the states (recall, if government employment had not declined, NFP employment would have increased in August), and of course substantial infrastructure investment (I argued for this back in the ARRA debates, but there were many Republican critics who argued that such spending would be ill timed, occurring long after the recession [4] … I expect those same critics to argue against infrastructure spending again, with yet different rationalizations [5]). Some other ideas [6].
Table 1 provides ranges of impacts (multipliers) for various policy measures, as reported by CBO in early 2010.
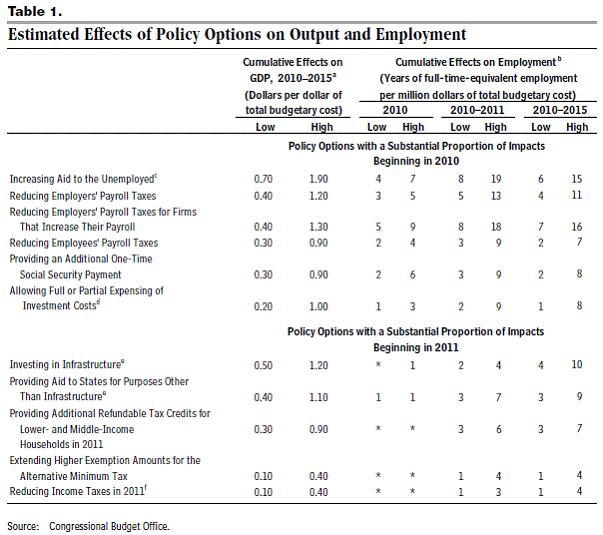
Source: CBO (2010).
Notwithstanding assertions to the contrary, there is evidence that these policies can have an impact; and if scaled sufficiently large, can help close the yawning output gap. Certainly, they must be more efficacious than faith based arguments that yet another marginal tax rate reduction that would unleash entrepreneurial energies, or increase investment by increasing after-tax corporate profits when corporate profits are at already all time highs.
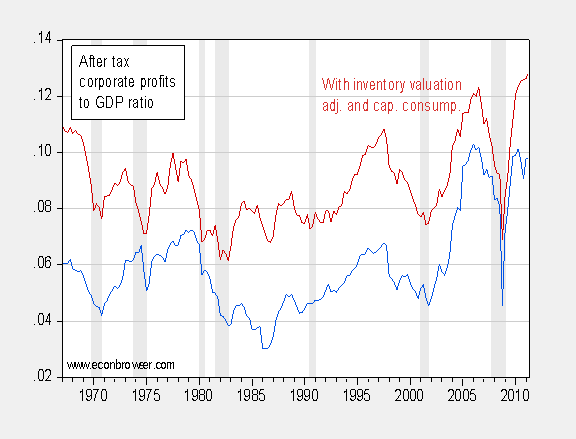
Figure 7: After tax corporate profits to GDP ratio (blue), including inventory valuation adjustment and capital consumption allowances (red), both SAAR. NBER defined recession dates shaded gray. Source: BEA, 2011Q2 2nd release, NBER, and author’s calculations.
We are not experiencing a “double-dip recession” but another credit cycle contraction within an ongoing debt-deflationary, slow-motion depression and further contraction of the 10-yr. real private per capita GDP, as occurred in the 1830s-40s, 1890s, late 1930s and early 1940s, and in Japan in the early ’00s, i.e. the Kondratiev or Long Wave deflationary Trough and Schumpeterian depression phase of the Long Wave.
This recession is occurring with 9-16% US unemployment/underemployment, falling participation ratio, and the peak Baby Boomer cohort reaching age 62-65 (when 65-85% of Americans begin drawing on Social Security and leave the labor force) between now and the early to mid-’20s.
The critical difference today is that the global debt-deflationary depression is occurring coincident with (1) peak global oil production, falling liquid fossil fuel net energy and oil exports per capita; (2) population/ecological overshoot; (3) demographic drag effects in Japan, EU, US, and eventually China; and (4) emerging sovereign fiscal constraints and increasing risk of insolvency.
There are no textbook prescriptions for these combined conditions and the cumulative global structural effects.
The official U rate could reach 13-15% in the next 18-30 months, whereas the U-6 rate could rise to 25%. Were the labor force to be growing at the rate of ’80s to early ’00s, the U rate today would be 11-12% and U-6 at 20%.
The composition of US household spending will shift permanently from high-multiplier outlays for housing, autos, durables, and children to low- or no-multiplier spending on utilities, house maintenance, insurance, and out-of-pocket costs for medical services and medications.
Not coincidentally, we will see a dramatic and permanent deceleration in the rate of household formation, marriages, and the Caucasian birth rate. The 80-year decline in persons per household has bottomed and is in the process of a multi-decade increase hereafter.
The overwhelming share of net US gov’t spending will be related to personal transfers in the form of unemployment payments, food stamps, Social Security, SSI, Medicare/Medicaid, and disability payments. There will be little or no money for “stimulus” (apart from spending for imperial wars and the national security state apparatus).
Personal transfers will continue to increase as a share of US personal income for years to come.
Consequently, there is a growing risk that the US fiscal deficit at some point during the rest of the decade will approach 100% of US gov’t receipts.
Few are prepared for the EU-like “austerity” we face in the US, most especially not the Baby Boomers and the 20 million Americans and their households who depend upon the public coffers for their livelihoods and income and medical services in late life.
couple points
it is incorrect that NBER waits mainly because of revisions. It waits
1 to confirm that is six months long and
2that the declines are enough. back when they watched points 5-7 and 9 of yours they required about a 0.5% drop in payrolls and a 5.0% drop in industrial production. So these are not just less than zero, but substantial declines from peak.
while it is valuable to look at income as much as spending (GDP) the reported GDI income series have been heavily adjusted to make them nearly match spending. The raw income data is only 85-87 % of spending but is raised with a series of misreporting adjustments to proprietors, W&S and profits to get within 1-2 % of spending. other countries handle this reconciliation differently. perhaps better to look at monthly pers inc less transfers or W@S or the more prompt Social security withholding data
@ Bruce:
“The composition of US household spending will shift permanently from high-multiplier outlays for housing, autos, durables, and children to low- or no-multiplier spending on utilities, house maintenance, insurance, and out-of-pocket costs for medical services and medications”
Amen and Amen. The older you get, the wiser you get. You realize that you do not need all of that consumer junk, even if you can afford it. Most people have a bunch of stuff in there house that they wonder why in the world they ever purchased it. No amount of demand side pump priming is going to change that. Maybe for QE3 the Fed could buy up all of the “toxic assests” we have wasted money on. I would let mine go for a few billion dollars.
Every business cycle is punctuated by wrangling over whether there will be or is a recession, and in recent cycles, whether there will be or is a second dip. This wrangling often involves a bunch of chest-thumping and trash talk about whose right and who was right earliest, all of which is just boring.
Zero has magic qualities in math, but not in much else. An economy running with a lot of slack wastes resources, regardless of whether there is growth in output in the current period. Other than that, the worry with contracting output is that it can be self-perpetuating. The same can happen with slow growth. When resources are being wasted, and the wasteful situation may be self-perpetuating, it’s pretty silly care whether NBER will someday declare that there has been a recession.
From a policy perspective, as well, we should do the same things in the face of inadequate growth as we would during contraction, though we’d probably do more of it as the under-shoot grows worse. We don’t need a label in order to prescribe a remedy.
I would prefer much simpler equal quarterly payments to every adult citizen unbacked by debt until unemployment declines. The Fed can still limit inflation while the Treasury limits the debt allowing for growth while debt contracts.
while NBER dating committee has born mostly unfair comment about their delay, they responded last time by noting that peaks and downturns had taken place which if extended (in time and amount) would be dated as a recession. But no sign yet from either them or the data now
@Menzie,
This is a question from a newbie. In the Table 1. from the CBO that you included above…is the effect of a borrowed versus tax revenue dollar taken into account? For example, if 60% of every budget dollar comes from taxes and 40% comes from increased federal debt…the effect on the economy of the borrowed 40 cents is a negative 40 cents in the I column (and a plus 40 cents in the G column from the identity GDP = C + G + I + net exports).
If I add a negative 40 cents to each of the numbers in the first to columns of Table 1 above…most of those policy options look like pretty silly ideas. So, does the CBO take the effect of borrowed money into account in its projections?
Thanks
Bruce: Re: paragraph 7 in your comment: “Caucasian birth rate”???
AWH (9:27AM): Well, I didn’t exclude the other reasons, but I think the “softness” of the advance GDP numbers is at least a big reason.
Regarding GDI vs. GDP, when I was on CEA staff, we often appealed to the average of the two. I don’t think that I’ve ever seen a formal statistical analysis examining whether that approach is worse or better than any other, in real time (which is relevant to this question).
JFK: Good question. These are ceteris paribus multipliers in principle — so increase in G holding constant lump sum taxes. The range is in part due to the different ways in which ceteris paribus is applied to monetary policy.
Why do you say log when the scales are
plainly linear?
Economists – charting the past, like driving in reverse through the rear view mirror. Generals fighting the last war. About as good as the chartists in the stock market.
It was called political economy for a good reason – the founders of the art realized that politics had much to do with what transpired. Of course, they were coming out of a mercantailist economy, just such as we are enjoying now. Government picks winners and losers; want some
Chrysler bonds?
Banks are laying their excess reserves in the Fed; big business is sitting on its capital; small businesses are not leading the resurgence, as they normally would; multi-nationals will not repartriot their earnings. Don’t you think that, in some instances, politics trumps metrics?
I seem to recall some important guy who talked of ‘irrational exuberism”. How about ‘irrational – or maybe rational – sceptimism/apprehension/fear’?
NBER reports that the average length of U.S. recessions since World War II has been 10.4 months and states there is no such definition of double dips,recessions are recorded as first come first served.
http://www.nber.org/cycles/cyclesmain.html
It is noticeable,the average contraction from picks to through have been shortened from 1945 to 2009 (11 cycles) and average expansion period from through to picks extended to a much longer time length.
This may provide for the transition to “This time is different”. Both economists sign and persist, countries are born equal when facing their liabilities in percentage of their GDP.
Liberty,Equality,Fraternity include:
Changing Interest Rates,Several studies of financial crises show that interest rates seldom indicate problems long in advance (the yield curve may be a lagging indicator).
Historical Precedents,debts burdens above 90 percent are associated with 1 percent lower median growth (Filling the output gap may be a long term goal).
Creative Accounting Devices (the observations do not include central banks ledgers)
Public and private debts and the potential of rising interest rates.
Reinhart and Rogoff: The Economy Can’t Grow With Debt (Blloomberg)
“Our results are based on a data set of public debt covering 44 countries for up to 200 years. The annual data set incorporates more than 3,700 observations spanning a wide range of political and historical circumstances, legal structures and monetary regimes.”
Re: Lost GDP.Is it not suggested by “recession” that the economy has been running at a rate beyond its potential for a considerable number of years perhaps with a bias toward one or two over-stimulated sectors?
In which case what sense can be made of any estimates of “potential” GDP growth rates?
Down
it says log GDP not log scale
so it is log(GDP)
don brown: rafaminos has it right. The series are logged, not the scales.
Stephen:I think the phrase you are looking for is “irrational exuberance“.
Gary Polk: Your conjecture is not supported by the CBO version of potential GDP; of course, there are many different estimates of potential GDP — see here.
Thet “potential GDP” line in figure 6 is I think the nub of the issue. I don’t believe it is accurate and don’t believe the historical series from which it extrapolates, a series which has been distorted by a series of financial bubbles. Finally, no matter what I believe, the extrapolation underlying this “potential GDP” line is too fraught with the potential for significant errors to form the basis for significant policy action, such as borrowing hundreds of billions.
The argument on this whole topic really boils down to whether the growth rates we are experiencing since 2009 (note: not 2008-2009) are normal or unusual/depressed. I believe they are “normal” and want to actually see the arguments that the last couple of years represent an unusual period.
That link on potential GDP from 2009 which Menzie provides in response to Gary’s question ducks many of the relevant questions. The counter-theory, according to my understanding, is that the growth rate in US GDP has been overestimated due to a) financial bubbles in each of the last three decades; b) overestimates of productivity growth due to increased spending on mis-measured sectors such as health care and education.
These factors don’t necessarily present conceptual difficulties, but they sure do create difficulties if one is arguing whether USD GDP’s long-term natural growth rate is 0.5% or 2.5%.
The latest revisions to productivity growth may get both the CBO and the Fed to adjust past and future potential GDP. Theoratically, a gap this big should have been associated with a significantly lower price deflator. Indeed, some studies think the deflator ought to be in negative territory given the current gap. The fact that it is not (yet?), may mean that the potential line was/is not as high as the current CBO numbers.
George: If I run a Phillips curve regression with GDP deflator on CBO output gap lagged one quarter, 3 lags of inflation, 2nd and 3rd lag of change in oil prices, and first lag of broad nominal dollar, over the 1986Q1-2011Q2 period, I obtain an adjusted R-squared of 0.48, SER of 0.007 (std. dev. of dep var 0.010). There is no evidence of structural break after 2009Q1 using the 1-step ahead recursive residuals Chow test, or after 2008Q3 using the n-step ahead recursive residuals Chow test. A CUSUM test fails to reject no structural instability.