Running a little behind, so I decided today to reprint something I wrote 4 years ago as an excuse to call attention to some charts I still think are pretty interesting.
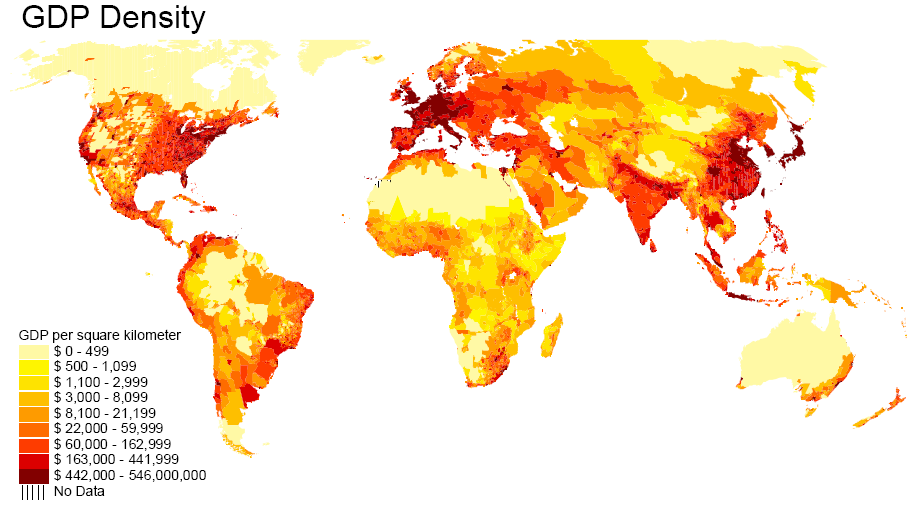
A paper by John Gallup, Jeffrey Sachs and Andrew Mellinger in the International Regional Science Review in 1999 introduced the concept of “GDP density”, calculated by multiplying GDP per capita by the number of people per square kilometer. Basically GDP density is a measure of the total amount of economic activity that takes place at different spots on our globe. I found the map they produced quite fascinating:

Not surprisingly, it looks a whole lot like those satellite pictures of the earth at night:
 |
Economists often try to explain differences in income across countries by factors such as the capital stock, education level, and institutions defining property rights, all of which the government could influence with appropriate policies. But when you look at pictures like these, you can’t help but be struck that there appear to be other very important and purely physical determinants of GDP. Economic activity clearly is much more intense near oceans, or, if inland, along navigable rivers where transportation by ship is feasible. Temperate climates with adequate rainfall also seem to be extremely important, perhaps for productivity of agriculture as well as for mitigating disease. When you look at just the United States, for example, no one would suggest that the big open stretches in the state of Utah imply that its governor has promoted policies that are hostile to business. Instead, the Utah desert, while one of the most beautiful spots on earth, is an inherently less suitable place for growing food or shipping products in and out. By the same principle, just looking at physical features, you’d predict that Afghanistan– a landlocked, mountainous desert– is destined to be poor, no matter what policies they adopt.
One of the lively areas of recent research in economics is trying to find empirical evidence of how much of a difference institutions can make for promoting economic activity. One could of course look at the obvious correlations between the level of economic activity and the kinds of policies and institutions in that country, but this is not very convincing. It might be, for example, that because the United States is rich in natural resources, our liberal institutions evolved as an outgrowth of that richness, rather than being the causal factor behind our wealth.
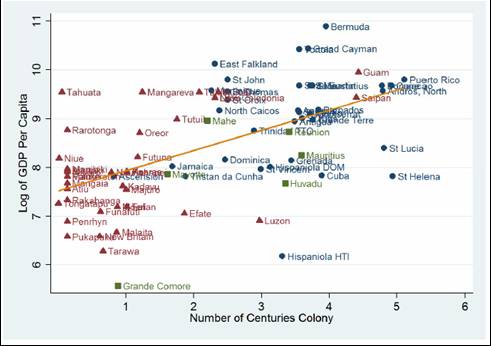
There’s an interesting new paper on this question by James Feyrer and Bruce Sacerdote of Dartmouth College. Rather than relying on the already well-analyzed data of the world’s 200 main countries, these authors developed new data on 80 ocean islands. They argued that the date at which these islands were colonized was to some degree a historical accident, and noted that the more years that island spent as a European colony, the higher its GDP is today:
 |
That correlation suggested to the authors that something about the institutions that accompanied colonization, such as laws protecting property rights and promoting capital markets, gave these islands an edge in economic development. On the other hand, another natural hypothesis is that those islands that were colonized first had the richest resources, and it is that inherently more favorable endowment that continues to help them today.
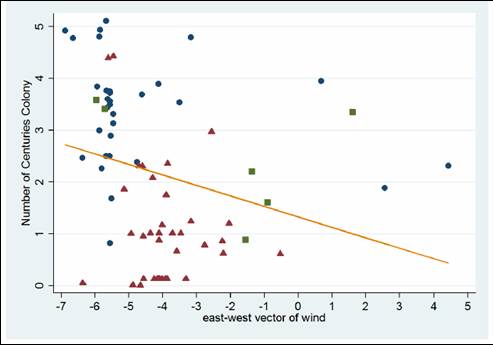
To try to resolve this fundamental ambiguity, the authors claimed to be able to explain the date of initial colonization in part by the magnitude of the prevailing winds. Their argument is that, before the 20th century, the most important determinant of whether a ship was likely to pass by or discover a given island was the strength of the east-west winds at that location. The empirical observation is that the stronger the wind, the longer the island was likely to spend as a colony:
 |
Feyrer and Sacerdote further observed that wind velocity should have been irrelevant for economic development after 1900. They therefore formed a prediction of how long a given island might have spent as a colony solely on the basis of the prevailing wind velocity, and then looked at the correlation between that prediction and the current GDP per capita. The argument is that, by using this first-stage prediction, one has isolated a statistical component of the time spent as a colony that is uncorrelated with factors that could otherwise be contributing to current GDP. They found a positive correlation, suggesting that institutions may indeed make a measurable contribution to current GDP.
Unfortunately, a critic could always object that, just as a strong wind may have helped determine when the first ship hit land, it would also have an influence on when the second ship arrived, and the third, so that it likely played a formative role in all sorts of important details such as the development of trade networks and accumulation of capital. This capital base may have provided a permanent benefit, which could perhaps be more important than anything about the current legal framework or institutions in determining GDP.
For that matter, a similar issue might account for the correlations between GDP density, ports, and climate. Perhaps the latter factors were important historically, causing physical and network capital to accumulate in certain locales, which remain prosperous today because of that capital rather than because of the ports or climate.
Physical scientists sometimes look down on economists for basing too much of our inference on guesswork and assumptions. But the truth is, most of us would love to be able to run a true controlled experiment to be able to resolve what causes what. Unfortunately, our main tool is to look at what actually happened historically in a given situation, where all kinds of variables are changing and influencing the outcome. Many of us therefore look for “natural experiments” that may have influenced such things as when an island was first colonized. But the answers, while interesting, very often fail to convincingly resolve the big debates.
I spend way to much time reading economics on the internet. But I have to say, this is the most interesting and perceptive post I have read in some time. There is much debate these days on different models and different visions of what makes things run – the great stagnation vs. scott sumner. Your post is a great reminder that it is more than alchemy,tax cuts, or expectations;the interaction of data and history – and geography! makes a difference in long term prosperity.
“One could of course look at the obvious correlations between the level of economic activity and the kinds of policies and institutions in that country, but this is not very convincing. It might be, for example, that because the United States sub-Saharan Africa is rich in natural resources, our liberal its corrupt institutions and ironic human poverty evolved as an outgrowth of that richness, rather than being the causal factor behind our wealth.”
Wait, that doesn’t fit the theory. Okay ignore that.
Great post.
The world would be a better place if economists spent more time thinking about stuff like this and less time torturing 20th century US GDP data.
“noted that the more years that island spent as a European colony, the higher its GDP is today”
All rules have their exceptions,the Normand may testify for it.
There was a paper by Lakshmi Iyer that looked at the effect of British colonization on development in India. Iyer looked at the difference in development between Indian states that were directly controlled by the British vs Indian States that were indirectly controlled (i.e. they maintained their own domestic policies and institutions) in order to determine the impact of British institutions on growth. There is an obvious selection problem since the British were probably more likely to directly control areas with greater resources, but Iyer solved this problem by using a British annexation rule from 1848-1856, which said the British would only take direct control of territories whose ruler died without a natural heir, as an instrumental variable. Since a leader death is probably mostly random, Iyer could get an unbiased estimate of the effect of British rule on development, and found that states under direct British rule are currently less developed than states not under direct rule.
http://www.people.hbs.edu/liyer/Iyer_Colonial_REStat.pdf
Being landlocked and mountainous desert does not predict Afghanistan being poor in the per capita sense.
The GDP density plot needs to be divided by population density and there is no geographical reason for Afghan poverty. In fact, historically Afghanistan was not particularly poor, relative to neighboring water-rich plains of Hindustan. Certainly the people were better fed in the Afghan hills so the Afghan mountaineers regularly bested Hindustani armies and provided a lot of rulers and feudal lords to Hindustan over the centuries.
I am sorry but I do not buy the how long a country has been a colony as a predictor of economic success because there is more to it than that. For example, we know that colonies which had English Common Law as the basis of their legal systems tend to be much more prosperous than those that had the French or German systems. It seems to me that it is the protection of property rights that is a much bigger factor.
This is a great post. It actually reminds me of “The Bottom Billion” a book I read a while back about global poverty, wherein the four biggest issues are:
1. Conflict
2. Natural Resources (wealth to oppress/Dutch disease)
3. Geography (Landlocked with bad neighbors)
4. Governance
http://www.amazon.com/Bottom-Billion-Poorest-Countries-Failing/dp/0195311450
For me, the primary determinant of economic performance is culture, and behind culture is religion.
For example, Argentina has at least the per capita endowment of natural resources that does the US. Unfortunately, it has a much greater endowment of Argentines, and behind them, the Spanish (and to a lesser extent, Italian) legacy. Thus Argentina is afflicted with the weak governance characteristic of Latin America as a whole most of the time.
Another example: Look at the entrants into the EU in the first eastern expansion:
Entrants were Poland, Hungary, Slovakia, Czech Republic, Slovenia, Lithuania: all primarily Catholic and Protestant. Also Estonia, Latvia (Lutheran).
Exclusions: Croatia (Catholic). Exlusion was due to the war. Most Hungarians viewed this exclusion as an aberration and injustice, frankly.
Other EU first round exclusions: Serbia, Ukraine, Belarus, Romania (now in), Bulgaria (now in), Moldova, Serbia, Bosnia: all Orthodox Christian or Muslim.
Now, there were no religious criteria for inclusion in the EU. All the criteria were objective (albeit, Turkey might not see it that way). But at the time, the countries meeting the criteria were largely those admitted; and the countries failing to meet the criteria were the ones excluded. It’s hard not to notice that economic performance and religious affiliation largely overlapped.
And note China. The Chinese have a huge work ethic, strong commitment to education, and an exceptional enterpreneurial and commercial culture. The country will no doubt have its ups and downs, but I believe its culture will see it through.
Correlation is not Causation, but correlation is correlation. Perhaps the Feyrer and Sacerdote article should go into the book “Economics for Dummies”.
As my old stats professor used to argue, there is an almost perfect correlation between the number of Baptists in a community and the number of arrests for drunken driving. Does this suggest that fundamentalism causes alcoholic behavior, or just that bigger towns have more of both?
I think we owe our good fortune to a wise Congress that takes care to remind us that our national motto is “In God We Trust.”
As we now know, a significant part of the alleged GDP in these graphs turns out to have been fictional. Made-up profits confected by con artists working the financial centers of the world.
On parliament Voltaire
“Il etait digne de notre nation de singes de regarder nos assassins comme nos protecteurs;nous sommes des mouches qui prenons le parti des araignées”
“It was worthy of our nation of monkeys to watch our assassins, as if they were our protectors;we are like flies taking the side of the spiders”
Very insightful post. I agree with your views and it looks clear we live in a disproportionate world. In one of my recent articles on my Global Economics blog, I tackled a similar subject. Correlated Moore’s Law with more profane things as macroeconomics and the shape of the future.
Btw, since I RSS subscribed to your site, I only came across good content and that’s a treat!
Dumitrascuta, Editor in Chief @ Dollar Mill
It always bothers me to see charts with a random dispersion pattern with a straight-line through them to prove ‘correlation’. Moving just a few data points would completely debunk the argument. To me, such charts scream “I’m trying too hard to invent a theory”.
More people should play the game Civilization. This is the most basic insight in the game – choosing where you want to set up your civilization. Other than natural resource tiles, being next to rivers, lakes and seas is the best way to build a prosperous civilization. Unfortunately that decision is made around 4000 BC and you can’t change it other than using violence.
Very interesting data with many uses: all discussions need to show GDP by area and population density since more people living near each other may make more stuff– if they are productive. The island story needs to account for GDP driven by tourism which is connected to past colony status. A spot on the map, an African dessert, with no people has no GDP; they move to a city with many people and no jobs to get a low GDP per area.
Best use for new data today: With an international debt crisis, in which locations are the people living above their GDP level? So do recent data show low GDP/ area spots in Greece, Italy, Spain? Does the US get its high scores by borrowing money to keep GDP up?
Many questions, that more data may shed light on.
OT,
British consumption, measure by mass is falling
I wonder how well some the these changes correlate with oil prices, private sector debt growth, and discretionary income.
Feyrer and Sacerdote were two of my favourite professors at Dartmouth. Unfortunately it looks like the link to the paper in the captions of the charts is broken — the link Feyrer gives on his webpage is: http://www.dartmouth.edu/~jfeyrer/islands_2007_09.pdf
So Switzerland is destined to be poor being landlocked and mountainous?
johnleemk: Thanks much, links fixed.
It really isn’t that hard. Think about East Germany vs. West Germany. South Korea vs. North Korea. Hong Kong and/or Taiwan vs. China under Mao. Chile vs. Peru or Argentina. How many examples do we need before admitting that property rights and the institutions that go along with them really matter a lot?