One of the startling things about consumption behavior is that, despite the burst of spending surrounding the holiday season, per capita consumption in 2011Q3 has only re-attained the levels of 2008Q3. Various explanations have been forwarded, ranging from the failure of Keynesian economics [0], to the decline in income prospects or higher income uncertainty, or to the decline in observed net worth [1] (deleveraging, in certain interpretations).
Figure 1 shows log GDP and consumption rescaled to 2009Q2=0.
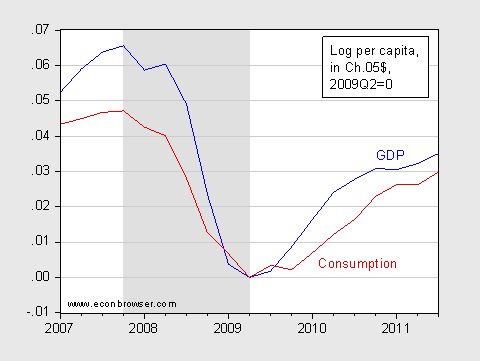
Figure 1: Log GDP (blue) and consumption (dark red), Ch.2005$, SAAR, rescaled to 2009Q2=0. NBER defined recession dates shaded gray. Source: BEA, 2011Q3 2nd release, NBER, and author’s calculations.
Taylor has argued that the failure of consumption to rise with income tax cuts is proof of the failure of the simple Keynesian consumption function, viz.
C = a + bYd
Where C is real consumption, and Yd is disposable income.
Of course, nobody really takes the simple Keynesian consumption function as a realistic depiction [Update: In his 2011 JEL article, Taylor incorporates a wealth effect.]. As far as I know, all large scale macroeconometric models incorporate a wealth variable.
C = a + bYd + cW
Where W is real wealth.
In this perspective, the decline in consumption, despite the maintenance of disposable income, is no surprise, given the massive decrease in net worth starting in 2007.
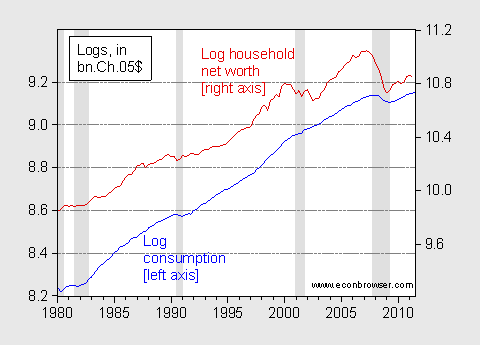
Figure 2: Log consumption, Ch.2005$, SAAR (blue, left scale), log household net worth in billions, deflated using PCE deflator (dark red, right scale). NBER defined recession dates shaded gray. Source: BEA, 2011Q3 2nd release, Fed via FRED, NBER, and author’s calculations.
There is some debate whether there is a distinction between the wealth effect and deleveraging. I think there is – the decline in wealth induces lower consumption, but higher income flow uncertainty and tighter liquidity constraints also affect consumption by alternative channels.
One point of interest is to think about the implications of Hall’s permanent income hypothesis. It’s important to recall that the model implies consumption service flows follow a random walk, rather than consumption expenditures. To the extent that service consumption expenditures most closely conform to the flow of services associated with consumption. Here’s a plot of the cumulative change in expenditure categories since 2009Q2.
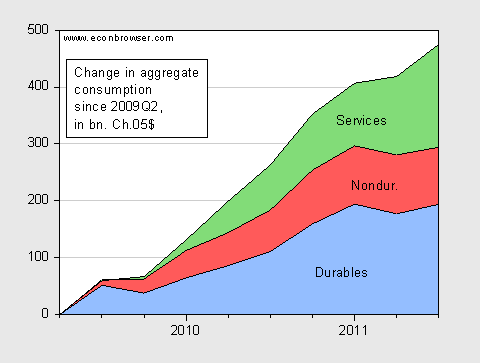
Figure 3: Change in consumption by category, in billions of Ch.2005$, SAAR, since 2009Q2. Source: BEA, 2011Q3 2nd release, Fed via FRED, and author’s calculations.
The fact that services consumption has rebounded sharply in the last quarter (at 2% annualized) is consistent with a jump in perceived permanent income (or a big decrease in liquidity constraints).
There is a limit to what can be gleaned from time series. That’s why Atif Mian, Kamalesh Rao, and Amir Sufi have appealed to cross section data to identify the impact of deleveraging on consumption. From “Household Balance Sheets, Consumption, and the Economic Slump”:
Until recently, macroeconomic models often abstracted away from variation across households in balance sheet strength. In this paper, we show that weak household balance sheets played a central role in the dramatic collapse in aggregate demand from 2007 to 2009, and the continued weakness in consumption through 2011. We show that the presence of high levels of leverage implies that a large negative shock, like the shock to the housing market, has serious distributional implications. In particular, households with high debt balances experience the sharpest reduction in net worth when a large asset class such as housing loses value.
We also show that net worth declines resulting from high household debt and a collapse in asset values have serious implications for the real economy through their impact on consumption. Highly levered households cut back drastically on their consumption in order to repair their impaired balance sheets. Despite a sharp reduction in interest rates, there is no compensating increase in consumption by the non-levered households. The net result is therefore a large reduction in aggregate demand.
We quantify this effect in this paper through the use of disaggregated, county-level consumption data. Measuring consumption has long been a challenge, especially at a disaggregated level and over long time periods. We overcome these challenges with a novel data set on county and zip code level consumption of new automobiles, and county level consumption of durable, non-durable and grocery purchases. Using prior literature on the relationship between housing supply elasticity and house prices, we instrument the household debt levels with housing supply elasticity of the county.
Our estimates show that the household balance sheet channel is responsible for a very large fraction of the decline in consumption during and after the recession. Further, household balance sheet problems continue to depress consumption through 2011. The distributional implications of large wealth shocks in the presence of leverage cannot be ignored.
The core of the Mian-Rao-Sufi thesis is illustrated by the cross section patter of heightened sensitivity of durables spending to high leverage and big shocks to asset values (primarily in housing). For automobiles, see Figure 3. For a comparison of durables to essential goods (groceries), see Figure 4.
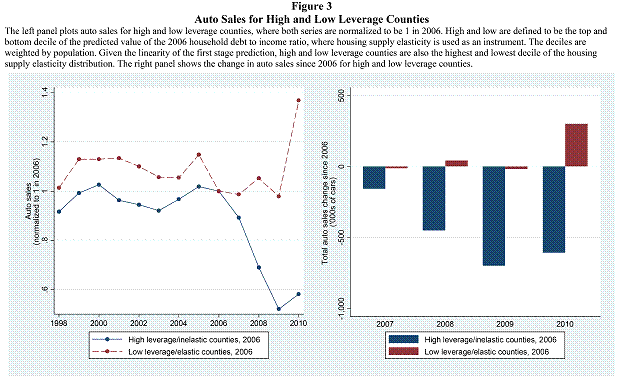
Figure 3 from Mian, Rao and Sufi (2011).
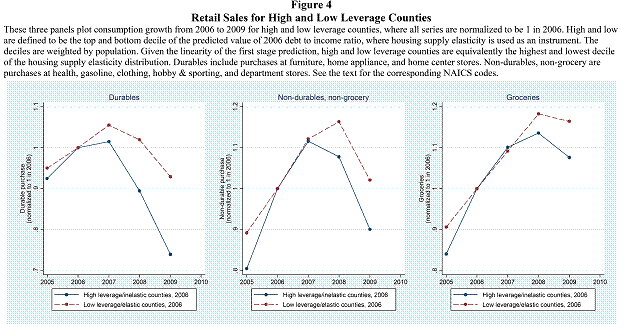
Figure 4 from Mian, Rao and Sufi (2011).
What are the policy implications? Although Mian et al. note that 65% of the job losses in the depth of the recession were due to balance sheet effects, they don’t make any specific policy recommendations. In my view, Torsten Slok’s assessment (“US Consumer Deleveraging: More adjustment needed,” December 2011, not online) provides a road map:
Most household deleveraging indicators are currently at their 2007/2008 levels. If they have to fall to their pre-housing bubble levels (=2003/2004 levels) then we still have several years of household deleveraging ahead of us. But how much more deleveraging to expect will depend importantly on what happens to equity and home prices. In other words, private consumption is not only driven by the liability side of households’ balance sheet but also — and perhaps most importantly — by the asset side.
In other words, working to reduce the indebtedness of highly leveraged households, either through formal restructuring or more rapid inflation, and supporting asset prices, will be necessary. Monetary policy can help support asset prices, but so too will faster economic growth which would accompany greater fiscal stimulus.
More from Mian and Sufi. More on deleveraging: [2] [3] [4].
Update, 12/6, 9:20am: Some policy implications from Atif Mian here.
Dr. Chin-
I would strongly recommend formal restructuring of household debt rather than inflation. Bankruptcy or debt forgiveness are far better than continually elevated price levels.
The US suffers from overpriced domestically produced goods, resulting in vast market penetration by Asian imports. Inflation will exacerbate US non-competitiveness.
Pumping up inflation and its inevitable companion: Expanded Securitization, supports the Eurodollar and multinational corporate interests. It does little or nothing for the debt slavery of the average US household.
I have been commenting about the constrained liquidity for the middle and low incomes on another blog. You have it described well here.
I don’t get this fascination with deleveraging. By itself paying down debt will not lower AD. To get to a story in which deleveraging leads to a drop in AD you need an entirely different story. As is the case with this post, this key element is either missing altogether or glossed over.
Menzie, from the 50K altitude level, what this article shows me is just how weak is the economists’ foundations of understanding.
The continuous searching for explanations, models, and workable policies is discomforting.
Professor Chin,
My sense is the wealth effect is about to turn neutral, having been highligh negative in 2009 and 2010. If house prices stop falling and the stock market remains range bound, will that be enough to keep the wealth effect neutral in 2012. And if so, would that not suggests consumption growth will accelerate in the absence of a negative wealth effect?
CoRev: Yes, that’s right. We should have settled on the Ptolemeic view of the heavens, and ignored additional data.
Jeff: Suppose there are two identical households, A and B. After time tau, household A receives income the same as it has in the past, while household B is suddenly liquidity constrained/rationed out of the market for credit, and the constraint binds. Will consumption be lower for B than for household A, after time tau?
John Anania: Holding wealth effects constant, consumption growth depends on what disposable income does (and with what volatility, according to Chris Carroll’s work). This would suggest an additional reason to favor not raising tax rates for those with high marginal propensity to consume.
This model formalizes what many have been saying since the recession began regarding the importance of the household balance sheet.
The short run monetary and fiscal stimulus packages we have been throwing at output and employment has been swamped by the effects cited above.
At this point, a further round of massive fiscal stimulus is not feasible, and as Menzi noted, monetary policy can only do so much. In either case, the short run marginal benefit from more stimulus is questionable compared to costs associated with long run debt effects and unintended monetary consequences.
That leaves growth as the best solution, but U.S. growth will be muted by slow global growth. This is a recipe for several years of stagnation.
The largest threat is that another large negative global shock occurs during this period of stagnation.
Someone needs to do a Venn diagram with two concentric circles, the inner one being solutions to our problems, the outer one being things we will not do under any circumstances.
Menzie: Consumption will of course be lower for B. But since B was borrowing from A, then A’s consumption will higher. The net effect to AD is zero.
Jeff: I think you are invoking Say’s Law. Assume assets. What happens then? For my tastes, I stick with Walras’ Law.
View from Teton County, Wyoming, one of the nation’s wealthiest counties. I’m not sure what the debt levels are here or what the housing supply elasticity is (I’ll see if it’s in Mian, Rao, Sufi (MRS)). But I know builders and other investors in real estate or real properties who were highly leveraged at the onset of the downturn. Their consumption pattern largely reflects the graphs in MRS. And I know several families who were not highly leveraged or in some cases not leveraged at all. They bought new cars as car prices hit their lows. The builders of whom I speak sold (often were forced to sell) real assets and now rent, drive smaller cars, take whatever small jobs they can find for much smaller margins. Ask them what they need in order to feel better about consuming more, and they’ll simply say, “More new construction.” What is the answer to their predicament, time, or more stimulus. Isn’t that the question?
MarkN
“What is the answer to their predicament, time, or more stimulus. Isn’t that the question?”
Yup, that’s the question, but it has already been too mush time and the stimulus has not worked. The answer is quit directing money through government and reduce taxation on investment activities. Something that the government class will not do without a whip from the voting taxpayer.
Ed – The problem is not investment as companies are sitting on plenty of money, it is demand. You tell me how you increase demand.
OT: November STEO is released. (Or, why is it that my oil comments are always timed for Menzie’s posts?)
November oil supply was 89.6 mbpd, 1.5% more than the same month a year earlier (which will be the standard of analysis here: month to month a year earlier). We have maintained that the oil supply must grow at 2.4 mbpd or so to hold prices steady (which is how we define the term “inherent demand”). US refiners’ average acquisition cost (RAC) increased by $23 / barrel over the period, consistent with our beliefs about the growth of inherent demand.
US consumption is down 1.4% (off 1.6% using a three month average), or about 300 kpbd. Thus, we’ve probably seen peak US oil consumption for this business cycle, and if I want to take a peak oil view, then we’ve seen the peak going forward, period. We won’t revisit the oil consumption levels of a year ago.
European oil consumption is down 3.1%, as the continent is more exposed Brent pricing and Greek drama.
WTI (NYMEX) oil was up sharply in November to $97, an increase of $11 over October, in large part the result of the announcement by Enbridge that it would reverse the flow of the Seaway Pipeline to take oil from Cushing (where WTI is measured) to the Gulf Coast.
Notwithstanding, average gasoline prices in the US continued to fall to $3.38 in November, as compared to $3.91 in May. Mid-continent refiners were able to access cheap Bakken crude from about April on, and they were able to fully capture these margins until November. However, it now appears the consumer is sharing the benefit of cheap Bakken oil as refiners compete to sell their product in the marketplace. Lower gasoline prices may also have something to do with record Black Friday retail sales.
However, as WTI prices begin to approach Brent, this trend will reverse. The impact could be $0.30 per gallon, bringing average retail prices back to around $3.70, where they stood in June.
For now, the US is enjoying a breather from high oil prices. Europe is not. And it shows in the economic statistics.
What is most remarkable about the Mian et. al. paper is that it is intuitively obvious — virtually a demonstration of economic identities involving consumption and savings. Their ingenuity lies in finding a way to disaggregate data for gross consumption and debt by county and income level.
What they “prove” is not the utility of a “model.” They make a simple empirical demonstration based upon inference from evidence, using nothing more sophisticated that accounting identities.
Now compare this with the debate between Nobel laureate John Taylor and former Council of Economic Advisors Christine Romer on the effectiveness of the stimulus:
http://krugman.blogs.nytimes.com/2011/11/19/christy-romer-on-fiscal-policy/
One is a mishmash of ideological shadow boxing using gross national statistics framed in political terms that proves nothing, either way. The other is… Mian et. al.
Menzie: Walras alone will not get you there. As I’m sure you are well aware, Walras’ law is simply an equilibrium condition that allows you to say something to the effect of “I see disequilibrium in the labor market therefor there must be disequilibrium in a financial market.”
At this point you can tell some sticky wage/price story for the labor market in which case the deleveraging problem is just a symptom not a cause. If you want deleveraging to be a symptom you need to tell some story as to why financial markets are not clearing. Now your getting somewhere interesting, but this brings me to my original complaint. This story is often missing or glossed over.
“If you want deleveraging to be a symptom you need to tell some story as to why financial markets are not clearing.”
There are several things happening here.
First, in order to keep the bubble going, banks created money equivalents and used them to inflate the effective money supply. They bought CMO’s, repoed them taking a cut of the interest and used the money from the repo to buy more CMOs and repeat the process. The velocity of money is very high in the repo market, and with 30 times leverage, even 1 or 2 percent gives a very nice ROI. However, when their collateral came into question, they had to sell their most marketable assets to maintain liquidity, while unwinding their transactions.
The money equivalents evaporated, and the effective money supply fell decreased drastically in a very short time (some small number of trillions of dollars). This caused a recession in the real economy, and mortgage defaults increased trashing the value off the banks’ remaining assets and lowering housing prices.
Many people have lost money they counted on for a new car or retirement. They reduced spending. Many defaulted on their mortgages.
This is the second point. Debt can be reduced by default as well as repayment. This is a loss both to the homeowner and the CMO holder, and the bargain someone else gets in buying the house doesn’t compensate. And, of course the time the house stands empty is a dead loss even if the house isn’t vandalized or destroyed by neglect.
Finally, there is no such thing as aggregate demand. It’s an concept that is only useful within a certain domain of validity (which is small). It’s useless outside it.
People don’t have the same marginal propensity to consume. They don’t have the same preferences, and these vary with time and disposable income. If a poor person buys 10 pounds of rice and beans, a rich person won’t buy ten tons or even any at all. Aggregating demand destroys the very effect you’re trying to model. If your model has only one person in it, then, yes, repayment has no effect. However, it also has no real meaning.
Now assume I take $10,000 from 1 million people who were planning to buy new cars and give it to Bill Gates. Will he buy 1 million cars? Will he use the money to buy a car factory, now that his potential customers just vanished?
Or will he buy treasuries and add to the shortage of safe assets? If he does, can the Fed recycle the money, if the banks won’t lend?
The asset inflation caused by loose money, financial creativity, and blatant fraud wasn’t matched by inflation measured by the GDP deflator.
This mismatch between financial and physical has to be resolved, since it represents two different theories about the quantity of goods and services the assets will purchase in the future for which they were intended to provide. Financial assets can never be a magically perfect form of time travel for consumption.
The debtors have one theory and the creditors have another. Resolution will be painful for both sides no matter which theory prevails. If the creditors win, they will suffer from the resulting deflation and recession. If it’s the debtors, they’ll be hurt by the resulting inflation. Debt forgiveness would be best approach, since it would produce the fastest recovery, but that’s just a more efficient form of the same alternatives. It would still have to be paid for by someone in some way.
Rather than debt forgiveness, which incents non-payment, the FED just needs to print $2.5 trillion and give $25,000 to the head of every U.S. household (For easy math assume 100,000,000 H of HH’s x $25,000 each).
The $25,000 goes directly to the mortgage lender to reduce the balance of the mortgage for those who owe $25,000 or more on their mortgage. Otherwise, the $25,000, or remaining balance, goes directly to the H of HH.
How is that any worse than stuffing $2.5 trillion into investment banks? Or, having congress borrow another $X trillion for a stimulus package and spend it on political cronies?
I’d rather see an equitable distribution where HH’s get the cash to reduce debt and stimulate consumption and employment.
We get a one time shot of inflation, but that’s okay given the slack in the economy. The dollar drops, but will recover because of the expectation for higher long run growth compared to the ‘counterfactual’ of no helicopter drop.
Robert Hurley you made an important inquiry;
“Ed – The problem is not investment as companies are sitting on plenty of money, it is demand. You tell me how you increase demand.”
Sitting on plenty of money is not investment, which says investment is still the problem. Investment is no different from any other transaction in that each participant sees an gain from the exchange. At the margin, the gain is not there which leads to the question, why?
The answer of lack of demand is a, “which came first the chicken or the egg”, question. Certainly in a psychological sense, demand is unlimited, and came first, and remains ever present, and is limited only by the extent of imagination. But in an economic sense, satisfaction of part of that demand can only occur by voluntary or involuntary exchange. I am not a proponent of involuntary exchange so the question remains how to return to greater voluntary exchange? I cannot simply demand an exchange, but must supply a product or labor in exchange which another values more than the product or labor given up. It is true in a simple barter system, and it is true under a money system, which allows for fractional split of what is supplied and given.
The answer of the chicken-egg problem in an economic sense is supply came first and remains what must come first.
Transactional exchange which is normal human enterprise because it leads to both side’s gain, and creation of wealth in general. There are many things which can interfere with such voluntary exchange. In today’s world and very much currently, the greatest impediment is the size of government which by taxation is taking too much of the top and by regulation and law is creating both certainty and uncertainty for the future value of investment is what is in the way.
The answer is not those policies which sustain the size of government, but a reduction of the size and scope. Demand enhancing policy does not serve the to reduce the problem. Removing government created disincentive does.
Jeff: I thought liquidity constraint was a sufficient friction. If you want to be be more specific, how about a Bernanke-Gertler financial accelerator mechanism?
Tackling mortgage debt directly is much more efficient than helicopter drops for a number of reasons.
1) Underwater households have no mobility. This negates one of the big advantages the US has over Europe – labor mobility
2) Foreclosure destroys both physical and financial capital. The losers’ loss has immediate effect with feedback. The winners’ (buyers out of foreclosure) gains work over time, through a wealth effect. And there’s dead weight loss while the property remains unsold
3) Home construction usually leads recoveries, and won’t recover while there’s a housing inventory glut
4) If you want to worry about incentives and moral hazard, you should start at the top – Goldman and friends. Follow the money. The financial sector has been by far the fastest growing part of the economy, yet it produces nothing. It’s all just account churning for fees on a herculean scale – destroy trillions to make billions.
Or you can believe the evil and cunning poor cheated the helpless and trusting banks by enriching them and going broke in the process. Who knew?
5)As Keen has observed, change in debt is effectively income. Lose this income, and you lose the corresponding demand. This graph tells the story.
http://research.stlouisfed.org/fredgraph.png?g=3Jo
The GDP – debt line shows how the economy would have performed without change in debt. It’s a look backward, since past GDP is the result of past demand including the effect of change of debt. GDP + debt shows what change in debt adds to demand. It’s a look forward. Notice what happens to the recession as you switch views.
6) A $2.5 trillion helicopter drop would be inflationary and would probably inflate another bubble. The Chinese tried something like this in 2008. Economists praised their decisive action compared to our dithering. Now we’re seeing the downside. The money inflated a huge property bubble and caused a lot of (often shoddy) construction for which their was no demand at anything like the break even price. This caused a crowding out of the productive economy. As with our bubble, the shadow banking sector created a lot of hidden debt that amplified the boom, and whose unwinding will amplify the bust.
7) There’s no such thing as a free lunch. The $2.5 trillion helicopter drop converts private debt into public debt with an efficiency of much less than 1. We need to reduce debt efficiently in a way that reduces total US debt. There may not be a confidence fairy, but there’s definitely a lack of confidence witch.
2008 was the golden year, and we should ever strive to recreate its economic conditions.
“2008 was the golden year, and we should ever strive to recreate its economic conditions.”
Alas, the Europeans seem to have surpassed us, strive though we might.
We haven’t even managed to fully inflate the student loan bubble yet, while they’ve managed to create a banking sector at least as sick as ours was and much larger as a percent of GDP. Even Lehman couldn’t reach 40 times leverage, while the Europeans did it effortlessly.
Perhaps they’re right about the weaknesses of the American capitalist model, since they’ve achieved what we didn’t even dare try.
Menzie: No the financial accelerator model is fine, I just want to see it front and center. If that’s your hypothesis for what’s behind the current recession, I presume you are applying to households only? So then the question remains, where do the real effects come in?
Jeff:
Financial assets have value because they are a claim
on future goods and services. If they become inflated relative to GDP, it’s just a version of the paradox of thrift. Everybody can’t cash in their financial assets for goods and services at the inflated price. There are too few of them, and the partial inflation is thus unstable. The outcome must be either inflation throughout the economy or asset deflation (which has the risk of an economy-wide deflation spiral or a few lost decades when there’s a lot of sticky debt).
The situation is stable as long as people believe they can move money between asset types with only known ordinary risk. The classic example would be a money market fund. Suppose people realized the fund’s counterparties were insolvent European banks. What would they do?
Suppose a significant number of owners of bubble priced homes had decided to sell them and use some of the money to buy fancy RVs in which to cruise the country or maybe houseboats to live in at resorts, and put the rest into annuities.
Could they all have done this? Of course not.
There’s nothing here that needs any fancy explanations, unless you use models that abstract away the phenomena you’re trying to study.
Unfortunately a lot of debt was created at bubble prices. This debt has the same problem as the bubble assets it inflated. It can’t be cashed in. There aren’t enough goods and people won’t supply enough services at that deep a discount. The bubble debt is what distinguishes the 2008 event from the internet bubble or 1987.
I expect that if the Fed tried an NGDP target they’d have to buy up most of the bubble debt to meet it. This might be a good idea, but you’re talking about another 2 or 3 trillion dollars.
Without this Fed miracle (which now has to include protecting us from Europe and China). You have three models among which to choose, Ireland, Iceland, or twentieth century Argentina.
“Consumption will of course be lower for B. But since B was borrowing from A, then A’s consumption will higher.”
Repayment of debt is not income, it’s a return of capital. ‘A’ isn’t wealthier and his income is reduced.