U.S. monetary policy has gone through three distinct phases since 2008. We may be about to begin the fourth.
I would characterize the period from February 2008 through March of 2009 as the first phase of recent U.S. monetary policy. During this period, the Fed was concerned about the possibility of a full-fledged financial panic, in which no one is sure which financial institutions are going to fail next and as a result nobody is willing to lend to anyone for any purpose. The Fed sought to fulfill its traditional mission of being the lender of last resort, which it implemented through a series of new initiatives summarized in Figure 1 below. The most important of these were currency swaps, the Commercial Paper Funding Facility, and the Term Auction Facility. The Fed also acquired some problematic assets through the Bear Stearns and AIG bailouts, which it has been gradually selling and writing off.
 |
By March of 2009, the threat of financial panic had subsided, but the economy was still in terrible shape. As the emergency lending programs were gradually unwound and closed, the Fed sought to maintain some stimulus by replacing these with purchases of mortgage-backed securities, agency debt, and long-term U.S. Treasury debt. The graph below displays total Fed assets, and shows that the net effect of Phase 2 was to maintain total assets at a fairly steady level through 2009 and most of 2010, even as the emergency lending was phased out. This second phase was often referred to in the financial press as an initial round of quantitative easing, or QE1.
 |
A third phase, popularly dubbed QE2, began in November 2010, as the Fed decided to expand its balance sheet further with additional Treasury purchases. This ended in June of this year, since which total Fed assets have plateaued at a level triple that in the start of 2007.
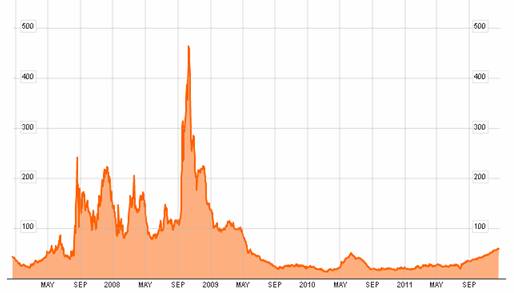
At the very last data point on each of the above figures (the December 14 totals), the eagle-eyed reader will detect a sharp but significant blip up. This can be seen more clearly in the following graph that focuses on just the last 9 months.
 |
The biggest component in last week’s jump in Fed assets was currency swaps. These had been under $2.5 billion since June of 2010 but spiked to $54 billion in the most recent week. That’s still a far cry from the $583 billion in swaps in December 2008, but indicates that the Fed has started to make a significant volume of dollar loans to foreign central banks, which dollars the foreign central banks in turn are lending to private banks. One indication of the strains on interbank Eurodollar lending that this is intended to address is the spread between 3-month LIBOR yields and 3-month U.S. Treasuries. This has continued to climb, though it remains far below levels seen in 2008.
 |
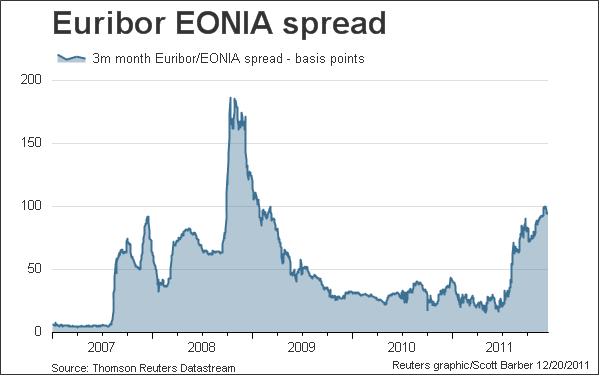
Another measure of financial stress is the spread
between the 3-month Euribor and overnight EONIA rates.
 |
Zero Hedge also noted an unusual $31 billion surge in Fed MBS purchases last week. This only brings the level of these back up to values in October, but it doesn’t seem to fit the recent pattern of MBS buying. That same article also infers that there was an unusual $2.5 billion one-day loan through the Fed’s discount window on December 13.
Phase 4, then, could turn out to be a return to emergency lending as the Fed tries to contain collateral damage from the unfolding European drama.
I assume we will eventually find out where the $2.5 billion loan went that is cited in the next to last paragraph above. Does anyone know if/when/how that info becomes available? What are some of the possibilities for a one day loan of that size?
Hush…don’t say this too loudly or Rick Perry and his supporter(s) will have even more cause to dish out Texas-style justice to that known traitor Ben Bernanke.
Nice post, up until the last sentence.
Interesting post on Walmart and the welfare state:
http://www.theforecaster.net/content/pnms-forum-rousselle-122111
JDH closed:
“”
There’s also the possibility that it represents the earliest phase of QE3, which the Fed hinted might be coming in its November 2011 meeting. Additional MBS purchases was signaled by New York Fed President William Dudley.
Related: The Effect of Quantitative Easing Upon Stock Prices, which provides some of the timeline.
Steve K,
Your objection to the final sentence?
I didn’t object to the last sentence, actually. It just caught me off guard.
While I was reading the post, I was thinking, “What a nice exposition for understanding the phases of Fed policy…”
But then comes the last sentence. I was emotionally unprepared for and-then-Granny-gets-hit-by-a-bus quality of Phase 4. There’s nothing wrong with the statement per se, it’s just grim.
I think the post misses the biggest effect of the Fed’s policy on the euro area. By encouraging the dollar carry trade (and dollar depreciation), the Fed has put great pressure on the euro area economies. This has been made worse by China’s policy of dollar pegging.
don,
Yes, you point out implict policy. Some call them unintended consequences, but I doubt the FED views the effect on the dollar as an unintended consequence.
JDH, If it applies, I think within your phases you should include a discussion of the impact of FED policy on the dollar. Which phases increased/decreased the value of the dollar? Was there a systematic relationship?
The 12/15/2011 H.4.1 under item 8 “Consolidated Statement of Condition of All Federal Reserve Banks” shows total assets of $2,905 billion and total capital of $54 billion, for a asset:capital ratio of 54:1 or less than 2% capital:assets.
In 2007, that ratio was more like 16:1 (6%).
The Fed would not allow a bank it regulates to operate in a condition like its current one.
It didn’t work out so well for Fannie/Freddie.
I know we had an emergency in Q4 2008, but it has been 3 years, shouldn’t they either raise capital or shed assets?
In a book in Russian language translated in French as “Les hommes double” The preface is dedicated to a quote:
“En Russie tout commence par une comédie ,se déroule en tragédie et après tout le monde s’en fout”
“In Russia all starts with a comedy,evolves as a tragedy and then, nobody cares”
That is not a Russian exclusivity that is the human comedy,no drama yet as we are still looking at the comedy part n.
Today’s (12/22/11) H.4.1 release shows total assets going up to $2,919 billion (up almost $14 billion — a rate of increase that would annualize to about 25%). Wow.
Re the newly found MBS position. I thought the Fed gad made some previous purchases that for whatever reason had quite long away delivery dates. Could this be some showing up just now?
Spragus, that is correct. The purchases of new MBS that are a result of the committees decision to reinvest maturities and paydowns of Agency Debt and MBS are done in the TBA market where settlement occurs 1, 2, or 3 months away from the purchase date. The uptick in MBS reported on the H.4.1 is simply a result of the first large settlement since the start of the reinvestment program.