One big story of 2011 was the United States switched from being a net importer to a net exporter of petroleum products. Here are the details behind that development.
The graph below plots the difference between U.S. exports and imports of petroleum products. On average in 2008, we had been importing about 1.8 million barrels per day more than we exported. So far in the second half of 2011, the difference has swung to an average positive net export balance of 0.4 million barrels per day. The exports are coming in the form of diesel and gasoline that is being sold all over the world, with the top 10 buyers in terms of growth of demand for U.S. products being Mexico, Netherlands, Chile, Canada, Spain, Brazil, Guatemala, Turkey, Argentina, and France.
 |
The first thing to understand about this number is that it refers only to net exports of refined petroleum products, calculated for example by subtracting the amount of gasoline that the U.S. imports from the amount of gasoline that we export. These imports or exports of refined products are far smaller in magnitude than the imports of crude oil, which is the raw material from which refined products are made. The small positive net export balance on petroleum products is still completely dwarfed by the huge negative balance on crude petroleum.
 |
Nevertheless, something real is happening here. What accounts for the new-found U.S. competitiveness? I think a key factor is that abundant new supplies of crude oil from Canada and North Dakota are now coming into the central United States. Between 1987 and 2008, West Texas Intermediate, the benchmark light, sweet crude oil for sale in Cushing, Oklahoma, sold for $1.50/barrel more than Brent, its North Sea counterpart. That differential vanished in 2009-2010, and so far in 2011, WTI has sold at an average price that astonishingly is almost $17/barrel cheaper than Brent.
 |
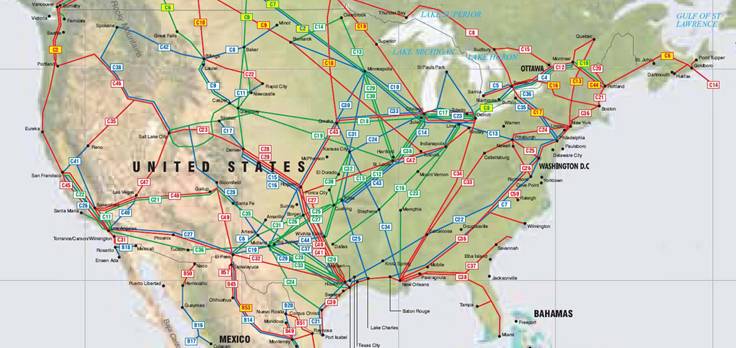
That price differential persists because the U.S. lacks the adequate infrastructure to transport the new crude all the way to refineries on the U.S. coasts. However, petroleum products move in different pipelines.
 |
 |
U.S. oil data are reported in terms of 5 main regions. One statistic of interest is the flow of crude petroleum and petroleum products from PADD 2, where WTI is being sold at such a discount, to PADD 3, where refiners are paying Brent prices to import oil by tanker, and from which refined products are often shipped abroad.
 |
Here’s what’s been happening to those flows from PADD 2 to PADD 3. During 2011, an additional 4.2 million barrels of crude oil were transported each month compared with 2009, and an extra 5.1 million barrels per month of petroleum products were transported.
 |
If you can’t ship the oil, then refine it where you are and ship the product.
By a wide margin, the single most important factor in the swing to net oil product exporter is the one you did not cite: the dramatic decline in US oil consumption from the highs of 2005-2006. At best, the increase in domestic production has been on the order of 500 kpbd. But the US has seen its consumption decline nearly 1900 kbpd. (2005 high compared to 2011 average). Indeed, the strong additions to existing refining capacity seen in the middle of last decade now serve not Americans, but the ROW, as we added to our industrial base by doing so. Not bad news, per se. But, the larger point should not be missed: the US is becoming a smaller economy, in oil consumption terms. The data on incomes, and food stamps, is clear: we are taking demand offline here in order to free up supply for the developing world. Thus proving another point which is that demand is much more elastic in the OECD than in the Non-OECD.
I agree with Gregor Macdonald. A link to, and an excerpt from, an article I wrote on the recent WSJ story on this topic follows. Note that I use 2004 as the reference datum for the US, because of the post-2004 decline in US oil production, as a result of hurricane damage.
http://www.energybulletin.net/stories/2011-12-02/de-constructing-wsjs-front-page-story-“us-nears-milestone-net-fuel-exporter”
De-constructing the WSJ’s front page story, “U.S. nears milestone: net fuel exporter”
Excerpt:
For 2011, it appears that the US is on track to be net exporter of refined petroleum products, on the order of about 0.2 mbpd. Although the WSJ reporters did note, several paragraphs into the story, that the US remains the world’s largest net oil importer, in both terms of crude oil and total petroleum liquids, I suspect that many casual readers will conclude that the US is now a net oil exporter.
We have of course seen increasing US oil (and gas) production. If we look at the pre-hurricane production data in 2004, versus 2010, US total petroleum liquids production rose from 7.2 mbpd in 2004 to 7.5 mbpd in 2010, an increase of 0.3 mbpd (BP). Note that BP does not count biofuels and refinery gains in the production numbers.
Over the same time frame, 2004 to 2010, US consumption fell from 20.7 mbpd to 19.1 mbpd, a decline of 1.6 mbpd. Based on the BP data, US net oil imports fell from 13.5 mbpd in 2004 to 11.6 mbpd in 2010, a decline of 1.9 mbpd*. Declining consumption resulted in 84% of the 2004 to 2010 decline in US net oil imports.
Therefore, the primary contributor to the US becoming a net exporter of refined products and the primary contributor to the decline in US net oil imports is declining consumption in the US, as the US and many other developed countries have been forced, post-2005, to take a declining share of a falling volume of Global Net Exports (GNE), which are calculated in terms of Total Petroleum Liquids.
So, the WSJ reporters are taking a symptom of Peak Exports, i.e., declining US oil consumption, and presenting it as a positive story.
*EIA uses different calculations, primarily due to biofuels and refinery gains
Five annual “Gap” charts follow, showing the gaps between where we would have been globally at the 2002 to 2005 rates of increase in production and exports, versus the actual data in 2010 (common vertical scale):
EIA Total Liquids (including biofuels):
http://i1095.photobucket.com/albums/i475/westexas/Slide1-18.jpg
BP Total Petroleum Liquids:
http://i1095.photobucket.com/albums/i475/westexas/Slide06.jpg
EIA Crude + Condensate:
http://i1095.photobucket.com/albums/i475/westexas/Slide05.jpg
Global Net Oil Exports (GNE, BP & Minor EIA data, Total Petroleum Liquids):
http://i1095.photobucket.com/albums/i475/westexas/Slide07.jpg
Available Net Exports (GNE less Chindia’s net imports):
http://i1095.photobucket.com/albums/i475/westexas/Slide08.jpg
I would particularly note the difference between the first chart, total liquids, and the last chart, Available Net Exports (ANE).
CERA & Yergin, et al tend to focus on the total liquids data while ignoring the GNE & ANE data. Since Yergin is now calling for less than a one percent per year rate of increase in total liquids productive “capacity,” which is similar to what we saw from 2005 to 2010 in the EIA total liquids data (+0.5%year), it seems to me that Yergin is, almost certainly without realizing it, in effect predicting a continued decline in GNE & ANE:
ANE, the supply of global net exports available to importers other than China & India, fell at 2.8%/year from 2005 to 2010.
I estimate that the ANE decline rate will accelerate to between 5%/year and 8%/year from 2010 to 2020. The following charts illustrate the two scenarios (based on two production decline scenarios for the top 33 net oil exporters):
Two GNE & ANE scenarios:
0.1%/year Production Decline (2010 to 2020), Top 33 Net Oil Exporters:
http://i1095.photobucket.com/albums/i475/westexas/Slide10-1.jpg
1.0%/year Production Decline (2010 to 2020), Top 33 Net Oil Exporters:
http://i1095.photobucket.com/albums/i475/westexas/Slide11.jpg
In common with other posters, I think you are missing the boat on this one. You say:
“If you can’t ship the oil, then refine it where you are and ship the product.”
Take a look at refinery utilization in PADD2. It doesn’t support this. Also look at reduced PADD 2 to PADD 1 product transfers. Also look at where ethanol production is occurring.
The reasons U.S. import/export of refined product has swung by 3mbpd is A)Lower consumption/sales of refined products in the U.S., B)Roughly Flat to slightly increasing refinery utilization nationally, C)Ethanol. The story you want to tell is explanatory of only a minor fraction of what is being seen.
While the point you are making is important, you did not do justice to the real numbers, nor the real flows.
First, we do not know of ANY importation of “gasoline” from Mexico and/or Canada. Nor from any other country. What we DO import is crude oil. A lot of it, from Mexico and Canada.
Second, both Canada and Mexico import from U.S. huge supplies of refined “gasoline” for their own domestic use, lacking the refinery capacity to provide for their own needs.
Third, to include THOSE numbers is disingenuous in the extreme. They were already there, and probably have not changed. much.
Fourth, to discuss shifts between Pad 2 and 3 is both important and economically significant.
But, to NOT discuss, in depth the shifts in CRUDE supplies between U.S. and the Maritimes, Ontario & Quebec, BC & WA, and, of course, Alberta and U.S. is inexcusable.
Fifth, once you have discussed and removed the above four (4) significant flows, you can – reasonably, economically and politically – address the REAL story you were going to tell U.S. – that there HAS been a major shift.
But, what you did not tell U.S. is precisely where it is, and how large it really is.
Please do, tis VERY interesting.
It would seem then that bad news is good news and good news is bad news… at least as far as oil/gasoline is concerned, but not necessarily as far as economic growth is concerned.
While accurate, I think that this post is far too subtle.
Because of the lack of a crude pipeline from Cushing to Houston, inland refineries are making money hand over fist. Doesn’t it strike anyone as insane that refineries near Detroit, Chicago, and St. Louis are refining diesel for export to China? But that is the situation. And except for a short time before the Beijing Olympics, it is unprecedented.
And if anyone wants to know why diesel is $1 a gallon more than gasoline, well, there you have it.
The ANE(S) will never fare, better and longer than the camels.
http://www.streetartutopia.com/?attachment_id=5990
Interesting. It highlights how markets react to circumstances. If and when new pipeline is built, that will create a new adjustment. This is a main reason why I read all estimates of benefits skeptically: they tend to look at only one piece of a picture. Either costs or the effects on other activity tend to be ignored. It’s like when people tell me they burned off 250 calories at the gym and I have to remind them they need to subtract what they would have burned anyway.
The following chart showing normalized oil consumption (total petroleum liquids, BP) for China, India, the Combined top 33 net oil exporters and the US from 2002 to 2010 (100 = 2002 consumption):
http://i1095.photobucket.com/albums/i475/westexas/Slide1-16.jpg
As noted up the thread, the supply of net oil exports from the top 33 net oil exporters available to importers other than China & India (ANE, or Available Net Exports) fell at 2.8%/year from 2005 to 2010.
As also noted up the thread, I estimate that ANE will fall at between 5%/year and 8%/year from 2010 to 2020.
The US is an example of forced energy conservation in OECD countries, as developed countries like the US are faced with taking what is left over after the developing countries, especially China & India, buy what they want.
At the 2005 to 2010 rate of increase in Chindia’s combined net imports, as a percentage of global net exports, the Chindia region alone would consume 100% of global net exports in about 19 years.
One of life’s little mysteries is that these GNE and ANE numbers are all but ignored, especially in the MSM.
Gregor MacDonald and others: Fair point, but please note that although I graphed net exports, the fact of the matter is that U.S. gross exports of petroleum products look similar, having doubled in the second half of 2011 relative to their values of 3 years ago. A drop in domestic demand is not a natural cause of an increase in gross exports. Instead, the key factor to look at is the source of the competitive advantage, which I submit is the differential in the relative price of the raw material. You make a valid point that this relative price resulted from both a decrease in domestic demand and an increase in domestic supply.
JGBellHimself: I can only infer that you did not bother to read what I wrote before you decided to start throwing bombs. (1) Net exports of crude petroleum are the huge negative value represented by the black line in Figure 2. The difference in both nature and magnitude between crude petroleum net exports and petroleum products net exports is the primary point of paragraph 3 above. (2) The countries in the last sentence of paragraph 2 are listed in order of the change between 2010 and 2011 in gross exports of petroleum products. (3) All graphs provided show actual numbers accurately, and, for example, clearly indicate how these numbers have changed over time. Did you even look at and understand any of these?
Certainly, product exports have increased this year, in part as a result of low regional crude prices.
Notwithstanding, I think the data better supports the argument of Gregor and others: US refining came free due to a peaking oil supply and declining US consumption. Resulting extra downstream capacity has been slated for either i) decommissioning (eg, some Valero capacity) or ii) re-deployed to product exports, which really take off after the oil supply stalls in late 2004.
The corollary of this phenomenon is that the integrated oil majors disintegrate in the OECD countries, with downstream being divested from upstream. Upstream remains a growth business, with Barclays reporting spend rising to $600 bn worldwide this year, up from less than $500 bn in 2010. By contrast, OECD downstream is a harvesting play, characterized gradual capacity reduction, a focus on cash dividends over capital gains, and capex primarily limited to existing plant maintenance. As such, upstream and downstream do not fit together today in the same corporate structures and strategies, explaining why Marathon, Conoco and Sunoco, among others, have moved to divest their US downstream operations.
As such, upstream and downstream do not fit together today in the same corporate structures and strategies, explaining why Marathon, Conoco and Sunoco, among others, have moved to divest their US downstream operations.
Are export plays by US refineries viable longer term? Would a country like China accept imports of product rather than importing crude and processing it itself in new domestic refineries?
Re: My post up the thread:
“At the 2005 to 2010 rate of increase in Chindia’s combined net imports, as a percentage of global net exports, the Chindia region alone would consume 100% of global net exports in about 19 years.”
Based on a model and several case histories, this projection, if more or less accurate, suggests that about half of the total post-2005 supply of cumulative net exports available to importers other than China & India, which could be abbreviated as CANE (Cumulative Available Net Exports), would be depleted by the end of 2013.
In other words, imagine a giant fuel tank, which represents CANE, the total cumulative volume of post-2005 (net) exported petroleum liquids available to importers other than China & India. If we extrapolate the 2005 to 2010 data, this fuel tank would be half empty by the end of 2013.
While I really don’t think that China & India will consume 100% of global net exports in 19 years, I do think that it is just a question of the slope of the ANE decline.
Steven Kopits: If the cause of the increase in gross exports of petroleum products were a collapse in domestic demand, one would expect to see this associated with a decline in refiners’ profits. If instead the cause were a new-found competitiveness due to a lower relative cost of the raw material, as I propose, one would expect to see this associated with an increase in refiners’ profits.
IEA http://www.eia.gov/forecasts/steo/pdf/steo_full.pdf)(Econbrowser:Implications of the recent rise in oil prices)
Unfortunately, this link is no longer handily providing for the information on the refiners margins.From memory,the new found healthy refiners margins,were not a long lasting history profile,not more than 2/3 years at most.In the interim, oil prices have not been departing much from the actual boundaries in prices.Implicitly that would mean lower demand for oil or higher supply during the same time frame and lower prices that failed to materialize.
could the surge in refined-products exports be due to the desire of domestic sellers of such products to prop up prices that are not justified by the present price of the crude used to produce these refined products ?
I don’t want to read too much into the data. Remember this data is the result of sub 3% GDP growth. We can probably all agree that the economy is operating well below it’s potential and historical norms. So if/when GDP growth exceeds and remains between 3% to 3.5% I suspect we will see the trend of being a diesel exporter reverse.
From my post up the thread:
“At the 2005 to 2010 rate of increase in Chindia’s combined net imports, as a percentage of global net exports (GNE), the Chindia region alone would consume 100% of global net exports in about 19 years.
One of life’s little mysteries is that these GNE and ANE numbers are all but ignored.”
Martin:
“So if/when GDP growth exceeds and remains between 3% to 3.5% I suspect we will see the trend of being a diesel exporter reverse.”
Incidentally, about 62% of the crude oil processed in US refineries comes from imports.
My expectation is that the US is well on its way to “freedom” from our reliance on foreign sources of oil–as we continue to be forced to take a declining share of a declining volume of Global Net Exports of oil.
Jeffrey J. Brown I am a little puzzled by your comment although I appreciate the feedback. If you recall the main point of the WSJ article and subsequent commentary was about the US becoming a net exporter of crude products namely diesel while stipulating that the US remains by large a net importer of crude.
Jeffrey why do you believe Global Net Exports of Oil will decline? Proven reserves continue to increase.
The pipeline from Canadian oil sands will only increase the US export of refined products, and US consumers will see little or no benefit. From a recent NYT article:
* Port Arthur, TX (the pipeline terminus) is a “Foreign Trade Zone”, so oil companies pay no tax on the vile stuff coming out of the proposed pipeline, nor do they pay any taxes on exporting refined products. Until I read this, I was mystified about why anyone wanted to build this thing. Now I get it.
* This is hard stuff to deal with. As someone pointed out, it does not come out of the ground, it IS the ground! Take some honey, warm it, mix in an equal volume of sand, and you have the right consistency. It has to be heated continuously or a pipeline could not work.
* Worse, the real tar sand has extremely corrosive chemicals, and of course the abrasiveness of the sand. This makes claims that “nothing bad can happen” along this enormous pipe simply a lie, as experience has shown.
These horrible pollutants must be removed from Alberta! We must clean the sands! 😉
Re: “Jeffrey why do you believe Global Net Exports of Oil will decline?”
Martin,
We compiled a data base of the top 33 net oil exporters in 2005 (those with 100,000 bpd or more of net exports), which accounts for 99%+ of total net exports. I refer to the sum of the top 33 net oil exports as Global Net Exports (GNE). We primarily used the BP data, with minor input from the EIA.
GNE declined at 1.3%/year from 2005 to 2010. If we extrapolate the 2005 to 2010 rates of change in production & consumption (which assumes basically flat production) in the top 33 net oil exporting countries, the GNE decline rate will accelerate to 1.6%./year from 2010 to 2020. If we assume a 1.0%/year production decline rate, the GNE decline rate would accelerate to 3.2%/year.
Available Net Exports (ANE), which I define as GNE less Chindia’s net imports, fell at 2.8%/year from 2005 to 2010. I estimate that the ANE decline rate will accelerate to between 5%/year and 8%/year between 2010 and 2020. This means that developed countries like the US will be forced to continue to take a declining share of a declining volume of GNE.
The primary reason that the US has become a net exporter of petroleum products is because of reduced domestic demand, as the US was forced, via price rationing, to reduce its consumption (84% of the decline in US net imports of total petroleum liquids from 2004 to 2010 was due to reduced consumption, using the BP data base).
However, note that many countries have shown increasing oil consumption, even as oil prices increased.
The following chart showing normalized oil consumption (total petroleum liquids, BP) for China, India, the Combined top 33 net oil exporters and the US from 2002 to 2010 (100 = 2002 consumption):
http://i1095.photobucket.com/albums/i475/westexas/Slide1-16.jpg
I suggest that you take a look at the “Gap Charts” linked on my first post up the thread.
For more info on the nature of net export declines, you can do a Google Search for: Peak Oil Versus Peak Exports.
You may recall the movie, “The Sixth Sense.” In the movie, many ghosts don’t know they are dead, and they only see what they want to see. For most Americans, our auto centric, suburban way of life is dead, but most of us don’t know it yet, and we only see what we want to see.
Refiner’s profits did, in fact, collapse with US consumption during 2008 (and they were nothing special before).
There’s no question that the WTI/Brent differential has helped US refineries, but this is a relatively recent phenomenon, mostly 2011.
As for engineer’s question regarding the durability of US products exports: The math depends on local capex in, say, Honduras for a new refinery versus increased transport costs from the US for product refined here. Given that refineries have high fixed costs, I would guess that unutilized US capacity would be lower cost (including transportation costs) than building a new refinery in a growing market.
However, I would expect US refining capacity to drift lower to better match US consumption. In addition, I have to believe the Democrats and EPA are going to look to reduce excess capacity in the US. So I guess I anticipate that exports will remain markets of opportunity rather than a strategic part of the business.
And, of course, all this depends on how US shale (tight) oil production pans out.
Jeffrey J. Brown I appreciate the charts. I’ll study them. When I look and Supply/Demand for crude I never looked at net exports. I always looked at production, proven reserves, and demand.
This is hard stuff to deal with. As someone pointed out, it does not come out of the ground, it IS the ground! Take some honey, warm it, mix in an equal volume of sand, and you have the right consistency. It has to be heated continuously or a pipeline could not work.
I am not sure that that is the case. My understanding is that they use a “diluent”, either naptha or napthalene or something of that nature, to transport the material.
I’m not entirely sure where the naptha comes from in the first place, and I do know that it is often just sent to the Cat Cracker rather than sent back up to Canada.
One question to all? Do any of you here believe that the extreme weather events in this country and globally are going to subside this year- or the rest of the decade?
C02 in the atmosphere as measured on the Keeling curve at Mauna Loa in HI by the NOAA will likely reach 397ppm this spring- highest in nearly 20 million years.
What does this mean going forward?
http://www.climate.ucla.edu/news/article.asp?parentid=4676
Food for thought.
Peter, that’s an interesting find. Few actually dispute the coupling/relationship to temperature; however, the ice core data shows that the relationship is temperature increase precedes CO2 increase by ~800 years.
Coupled? Yes. CO2 causative? Still TBD, especially in the amount of impact.
Each new discovery; each new source of the black liquid input for refineries pushes back the Hubbert Peak just a little. Then that source’s output diminishes as all have since the first well–look at the “bump” that north Slope oil produced. Eventually supply’s inability to give will choke economic growth and force alternatives. That will be the tipping point for oil’s demise as energy king.