In my previous post, I cited Jeff Frieden’s and my proposal for a conditional inflation target. Yet, according to several observers, we are either on the brink of crowding out due to elevated government deficits [0], or high to hyperinflation, due to monetary base expansion [1]. As has been noted, none of these outcomes have yet materialized, despite months of such warnings. [2] [3] Here, I wanted to evaluate where market expectations stand on these views.
Nominal interest rates
As of December 28, constant maturity yields on five and ten year Treasury bills are at an all time (post-War) low.
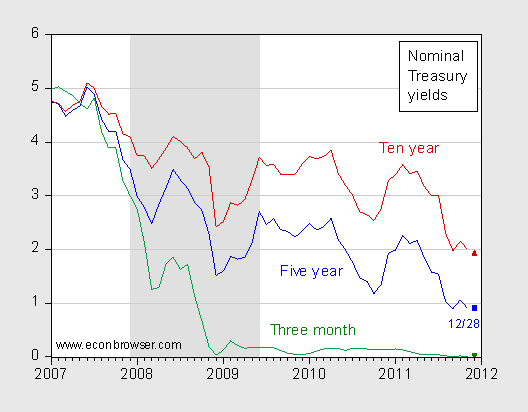
Figure 1: Constant maturity yields on five year Treasurys (blue), ten year Treasurys (red), and on three month Treasurys, secondary market (green). Observations for December apply to December 28th observation. NBER defined recession dates shaded gray. Source: St. Louis Fed FRED.
According to the Fisherian relationship, the nominal interest rate is the sum of the ex ante real interest rate and the expected inflation rate. What do real interest rates look like? One can proxy real interest rates by examining yields on Treasury inflation protected securities (TIPS).
Real Interest Rates
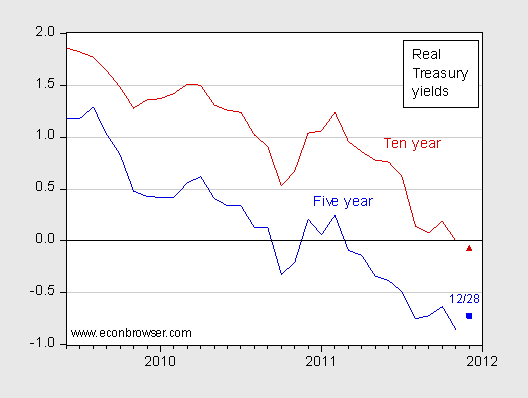
Figure 2: Constant maturity TIPS yields on five year Treasurys (blue) and on ten year Treasurys (red). Observations for December apply to December 28th observation. Source: St. Louis Fed FRED.
Well, it is likely that real interest rates would be lower in the presence of smaller deficits. However, with long term real interest rates negative (and persistently so for the bulk of 2011), it’s not clear that would be such a wonderful thing if lower deficits are associated with less economic activity. After all, it is unclear what the sensitivity of investment to the user cost of capital (for some discussion plausible vs. implausible – aka Ryan Plan/Heritage), see this post. Weighed against any higher investment arising from lower real rates would be lower investment arising from the accelerator effect.
One might worry about characteristics in the TIPS market distorting the estimates of the real yields. Hence, I provide the mid-quarter real rates calculated subtracting the Survey of Professional Forecasters’ mean ten year inflation from the ten year constant maturity Treasury yields.
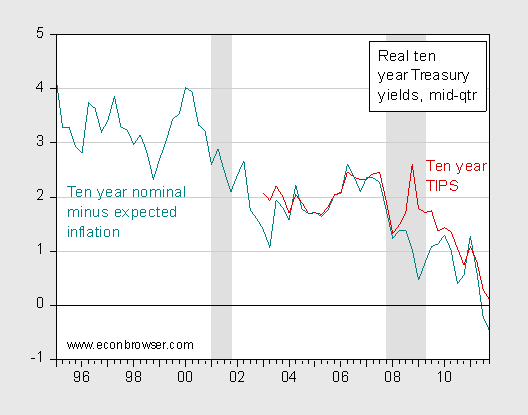
Figure 3: Ten year constant maturity real interest rates from TIPS (red) and calculated using the ten year constant maturity Treasury yields minus ten year mean expected inflation rates, sampled at mid-quarter. NBER recession dates shaded gray. Source: St. Louis Fed FRED, Survey of Professional Forecasters, NBER and author’s calculations.
Expected Inflation
One can use calculate the expected inflation rates using the nominal-TIPS spread.
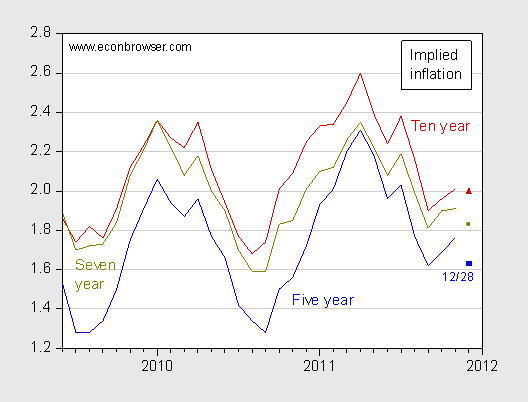
Figure 4: Implied inflation calculated as difference between constant maturity TIPS yields on five year Treasurys (blue), seven year (chartreuse), and ten year (red). Observations for December apply to December 28th observation. Source: St. Louis Fed FRED, and author’s calculations.
If anything, implied inflation derived from market expectations are either constant or declining. Figure 5 from the November Survey of Professional Forecasters shows the median forecast rising up to mid-2009 levels.
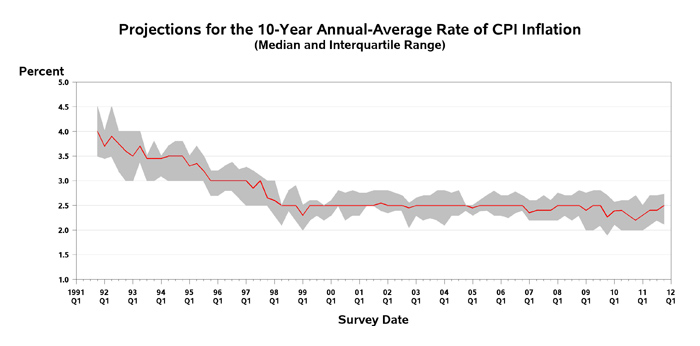
Figure 5, from November Survey of Professional Forecasters.
The December WSJ survey of forecasters indicates year-on-year inflation decreasing from 3.29% in December 2011 to 2.35% in December 2013. The median decreases from 3.3% to 2.2%, while the standard deviation rises from 0.30 to 0.79. Much of this is driven by outliers — in particular a 5.2% estimate from Mark Nielson of MacroEcon Global Advisers (Mark Nielson keeps on showing up as an outlier, see [4], [5]).
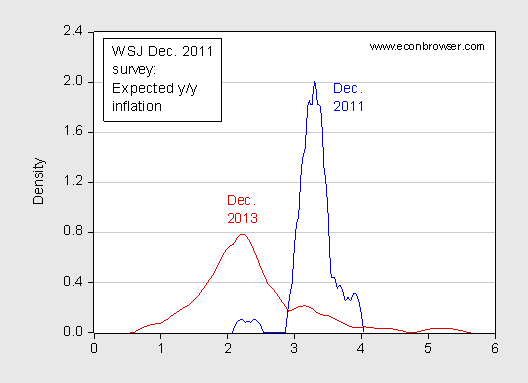
Figure 6: Kernel density graphs for expected inflation for December 2011 (blue) and for December 2013 (red), from WSJ Survey of Forecasters, December 2011.
To sum up:
- Nominal yields are at or near all time (post-War) lows.
- Real interest rates at five or ten year horizons are negative. Five year yields have been below zero for most of 2011.
- Derived expected inflation rates at the 5, 7 and 10 year horizons are all at or below the two percent rate.
- Survey based expected inflation rates over the next ten years is at 2.5 percent.
The Nominal and Real Yield Curves
Finally, it’s of interest to see what the yield curve looks like. In Chinn and Kucko (2010), we document the explanatory power of the yield curve for future economic activity across countries and time. We examined only the nominal curve. As Jim has discussed, one could argue for an examination of the real yield curve, which abstracts away from an inflation risk premium.
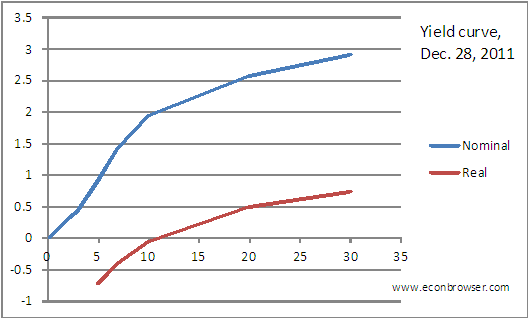
Figure 7: Nominal yield curve (blue) and real yield curve (red), as of December 28, 2011. Source: St. Louis Fed FRED.
The real yield curve starts at five years, so one can’t be sure what the real yield curve suggests for the horizon less than five years. What is true is that for securities maturing at the 7 month, three year and one month, and four year and four month horizons, the yields are increasing (or less negative), although with a relatively flat slope. That suggests only moderately accelerating economic activity over these horizons.
I find one point interesting. Back in 2005, when I argued that running budget deficits at full employment was a bad idea, likely to constrain our future policy options should we experience an economic setback, I often heard that we should be borrowing because interest rates were so low. Well, interest rates are now even lower than they were in 2003 and 2004, but now the output and unemployment gaps large; where are those voices now?
What ‘market’ expectations are you talking about? The Fed’s explicit policy is to distort all price signals in the rate markets. What is the point of talking about it as something meaningful at this point? Shows how pernicious the Fed policy is when it takes in even professional economists.
“One might worry about characteristics in the TIPS market distorting the estimates of the real yields.”
and
“The real yield curve starts at five years, so one can’t be sure what the real yield curve suggests for the horizon less than five years. ”
Why not use zero coupon inflation swap prices? They (supposedly) don’t suffer from some of the same distortions as TIPS (liquidity premia), and you can get shorter terms.
For instance, here is the 2 year inflation swap.
http://www.bloomberg.com/apps/quote?ticker=USSWIT2:IND
Just subtract the 2 year swap rate from the nominal 2 year rate and you have the 2 year real rate.
My dad used to make fun of Hoover – grew up in the Great Depression – by repeating, “Prosperity is just around the corner.” It turned out to be a very, very, very long block.
The mantra now is “Inflation is just around the corner.” It’s already been a long block.
The fundamental flaw with analysis is that markets reflect The expected value of future outcomes. It’s not that the market expects no hyperinflation, but rather that deflation is equally likely. The truth is that the imbalances in the US economy are terrifyingly large and that either of these outcomes is reasonable if the feedback loops that drive them are allowed to get rolling. don’t let your technocratic lust for stimulus blind you to the fragility and unpredictability of the present state.
Re: anonymous
“It’s not that the market expects no hyperinflation, but rather that deflation is equally likely.”
Actually, the odds of deflation, as predicted by the market, are around 13%, a bit below the historical average. This can be seen at: http://www.frbatlanta.org/research/inflationproject/111229a.cfm?method=display_inflationProject. If the odds of deflation are equally likely as hyperinflation, then it would seem the market is not too worried about either.
I personally believe futures markets are extrapolations of current sentiment, not forecasts, which implies relatively poor anticipation of turning points. This market failure (should we consider it one) is due to an experiential bias in decision-making (ie, decisions are made on experienced conditions, not upon the forecasts of analysts). Read my article, “Rigs, Recessions and the Tyranny of the Futures Curve” where I look at this issue wrt order cycles for offshore drilling rigs.
http://www.douglas-westwood.com/files/files/594-PR%20DEC%202010%20P35_36.pdf
Mercantilists always follow the Whitewash theory of the business cycle – if you whitewash a rotting house long enough it will repair itself. All we need is a little more spending, a little more borrowing, a little more inflation, a little more monetary expansion, a little more regulation, a little more government, and soon all will be well.
Jonathan, your dad’s ridicule of Hoover was spot on. If you really understand what he meant you can see how it relates to our current Hooverists.
Mercantilists always want to debate why their critics’s most dire predictions don’t come true rather than why their mercantilist policies keep stretching the blocks longer and longer.
“Actually, the odds of deflation, as predicted by the market, are around 13%, a bit below the historical average.”
While that statement seems valid, it misses the point. The probability references the CPI level being lower than it is now in exactly 5 years time. A number of things could satisfy this measured condition: a stagnant price level, a run-of-the-mill recession 4 years from now, or a catastrophic debt-deflation feedback loop. They could all produce an equal outcome in this view.
The odds should be viewed in context with likely magnitudes. The present time is unlike any other in the postwar period. Should deflationary winds return, the traditional tools and buffers at our disposal are limited. Attempting to reflate unconventionally (as the Fed has been doing for some time now) is not a science, and open the door to a wild range of potential outcomes and unintended side effects — one of which could in due course turn out to be hyperinflation.
In short, that the extreme are no more “likely” than in times past, or even that they are equally likely, should be of little comfort, because our financial system has never — not even remotely — been so 1.) levered 2.) interconnected and 3.) insolvent all at once.
The federal reserve has presently successfully arrested what otherwise would have easily been the the largest debt-deflation spiral in history, and possibly monetary collapse (note that mankind has a mere 40 years experience with global fiat currency). To take the success of its current balancing act for granted is the pinnacle of naivete.
I, like everyone, hope we can muddle through. If the balance of forces the Fed is fighting shift, however, we must realize that extreme outcomes are possible and that we have no reasonable analogue for the current situation in history to draw predictions from.
Ricardo: Whitewash theory? I’m assuming that if I substitute “less” for where you write “more,” your preferences are revealed. Right?
So less spending, less borrowing, less inflation, less monetary expansion, less regulation, less government–and “soon all will be well.”
So let’s check the recent record. The private sector is certainly spending less. That means they are borrowing less, as well. The Bush administration regulated less, that’s certainly in the record. We have fewer government employees now where total employment is lower, top to bottom. Our proposed defense budget is lower this year than last, and we’re out of Iraq so there’s some ‘less’ there certainly.
As for government deficits and debt, the record is clear. We went from $4 trillion in debt in 2000, to $10 trillion in debt by the time Obama was sworn in. That was a big mistake, of course.
We do have less inflation, so you should be satisfied with the current experience there.
Monetary expansion? We have negative interest rates, and base money is declining, not increasing. Although the various metrics are volatile, all the monetary measures are far below long term trend growth.
http://www.shadowstats.com/charts/monetary-base-money-supply
In my opinion you are now in the situation you like. We all have a lot less. And I do agree that if you get more of what you want, the block will indeed be long–and full of potholes.
No, not at all. You construct a strawman to tear down. But in truth your criticism of your strawman is not even accurate.
The government is not borrowing less. We ended the year of 2011 with a debt greater than GDP.
The record actually states that Bush regulated more. All presidents since Hoover with the exception of Ronald Reagan have regulated more. That is the record.
On monetary expansion take a look at a graph of MZM since 2000.
But all of that doesn’t matter. You are locked into a mercantilist-consumption mentality so you argue either more money or less money. That is like saying the Japanese are more prosperous that the Americans because a hamburger cost more yen than dollars.
There is actually a negative effect when government spends as opposed to the private sector spending because governments inability to use profit signals means they do not have the knowledge to determine whether a project gains or loses, among other problems, but that is not significant as long as the private sector is allowed to continue to produce.
But in truth the problem is that incentives to produce have been stripped out of our economy and so there can be no growth. Growth has essentially been outsourced to other countries.
“incentives to produce have been stripped out of our economy”
The 15% cap gains rate sure is a incentive killer!
I stopped reading your article when you stated a “conditional inflation target”. Central banks have no idea what inflation is! the original quantity theory was MxV =P xQ, not the useless simplified version you find in every Keynesian textbooks which is MxV= Px Y. In the original version, Q is “everything”, current and past production and more. The P is price of “everything that money is spent on!. The simplified version is Y is real income and P should be price deflator, whcih some substitute the CPI for. The key point is that the P in both equations are not the same P. You cannot measure the price of “everything” nor can you possibly measure the neccesary weights. SO to propse a “conditional inflation target” is asking the central bank to drive down a road seeing in front of them what happenned 30 seconds ago. Well good luck with that!
Professor, reading the comments on your posts – and your co-blogger’s – leads me to develop a small idea. Call it “Conservation of Cranks”. There are notable cranks in physics – circulons, auto- dynamics being two of the better known idiocies – but they have to fight not just uphill but straight up a sheer cliff formed by massive quantities of empirical evidence. They flit about the edges, run their websites – usually by themselves or by the one acolyte who thinks he’s the next Saul of Tarsus.
But in economics, you get every kind of whack-job imaginable. It seems everyone has their own idea of how economics “really works”.
This suggests:
1. Barriers to crank entry in economics are low, high in areas like physics. Biology has them but they have that darned religion problem: the earth is only 10k years old and variants! The barriers in physics are especially high because the jargon is hard and you need to be able to pretend to do actual math.
2. Assuming we produce a number of cranks, if we then assume – yes, that’s two levels of assumptions – these cranks need to express their crankiness, then we get a conservation relationship that shifts them into economics and away from harder sciences like physics.
3. This suggests the old and I assume still famous internet crank test needs to be revised. It is heavily physics oriented – references to Newton, Fenymann receive lots of points – and needs to be adjusted for economics.
Speaking of cranks, I start to giggle at comments that say “Well, looking at *this* instead of…” when talking about data. I used to do this funny set of equations that proved 1 == 2 when I taught calculus to be funny and to prove a point to the students. The cranks here are doing the same thing except they believe it.
In Physics or mathematics, one doesn’t start off doing or picking equations dependent on one’s political bent. It seems most Economics now is just used as justification for someone’s political flavor left or right. The cranks who comment here are wrong on all accounts but their entire world view would be shattered if they admitted that Krugman was right about 90% of the time and still is. But he just *can’t* be because he’s a well-known liberal so they have to ignore his views and choose some other set of wacky stats. It’s like arguing with someone that the world is 6k years old…no logic really, just cherry pick out of sequence “facts”.
Unless the profession is purged of these people, I’m afraid it will be just marginalized in the future because more and more people are realizing this.