In a period of deleveraging such as the U.S. has been going through, it is possible for the natural rate of interest to become negative. Since cash is always an option for earning at least a yield of zero, no asset should ever pay less than zero. This lower bound of zero on nominal interest rates can put a constraint on the ability of the economy to self-correct or the Fed to provide stimulus in such a situation.
The Fed still has some tools to try to reduce longer-term yields, namely large-scale asset purchases and
signaling the Fed’s future intentions. A new research paper by Federal Reserve Bank of San Francisco President John Williams and Senior Research Advisor Eric Swanson proposes a creative new approach to measuring when and to what extent the zero lower bound is a relevant constraint on interest rates of any maturity.
Market watchers are familiar with the observation that bond yields often are moved by economic news. For example, when the Bureau of Labor Statistics released a better-than-expected employment report two weeks ago, the yield on 10-year bonds jumped 10 basis points. In their new paper, Swanson and Williams measured the average response over 1990-2000 in the n-period bond yield to a dozen different economic news releases such as nonfarm payrolls, new home sales, retail sales, and the CPI. They summarized that historical response in the form of a regression:

Here Δitn denotes the change on day t in the yield on an n-period bond, an is the regression intercept, Xt is a (12 x 1) vector containing the difference between the announced and market-expected value for a dozen different macroeconomic variables (with most of the elements zero except on the day of a news release for that variable), bn is a (1 x 12) vector of estimated OLS regression coefficients, and etn is the regression error. They then looked at how the response of that yield to these same news announcements over a 1-year interval around some day τ in the more recent period differed from the 1990-2000 typical value, as summarized by another regression

where the values of the regression intercept γτn and slope δτn are estimated just using data in a one-year interval around τ and bn is the value of the coefficient vector as estimated by the first regression over 1990-2000. Thus a value of δτn = 1 would indicate that the n-period yield was responding to news around date τ about the same way it did in the 1990s. A value of δτn greater than one means the interest rate was even more sensitive to news in the later period, and a value less than one means the interest rate was less sensitive to news than it had been historically.
The following graph shows Swanson and Williams’ estimated value for δτn for n the 3-month U.S. Treasury bill, plotted as a function of τ. As the T-bill rate fell below 1% in 2003, the value of δτn became statistically significantly less than one (indicated on the graph by a yellow region). The estimated sensitivity continued to fall and became statistically indistinguishable from zero (indicated by pink shading) in 2004– in other words, the T-bill rate was basically not responding at all to news at this time. Since the beginning of last year, we’ve been in a new episode in which the T-bill rate is unresponsive to news. The interpretation is it is not just the overnight rate, but the 3-month rate as well, that everyone sees as stuck near zero. Nothing that happens in the economy seems to change that perception.
|
By contrast, the 1-year Treasury yield continued to have a statistically significant response to news throughout 2003-2006, although it became a milder response than exhibited historically. On the other hand, since the middle of last year the 1-year rate doesn’t really seem to move in response to economic news, just like the 3-month rate.
|
The two-year rate continues to exhibit a measurable response to daily news, although the size of the response is only about half of what would historically be expected.
|
Interestingly, the 5-year yield seems to respond to news pretty much the way it always did.
|
University of Chicago Professor Cynthia Wu and I developed a model that could explain this behavior in a research paper that just appeared in the Journal of Money, Credit and Banking. We proposed that investors know that the overnight rate is currently stuck at zero, but see some possibility of escaping from the zero lower bound at some point in the future. We developed a formula to predict the response of the n-period yield to news as a function of that assessed probability. Longer-term bonds respond to news much more than shorter-term bonds at the zero lower bound because investors anticipate that the overnight rate will be nonzero over more of the life of the longer-term bond. The Swanson-Williams approach suggests an interesting way to come up with an empirical estimate of how the market’s perceived longevity of the zero-lower-bound regime has changed over time.
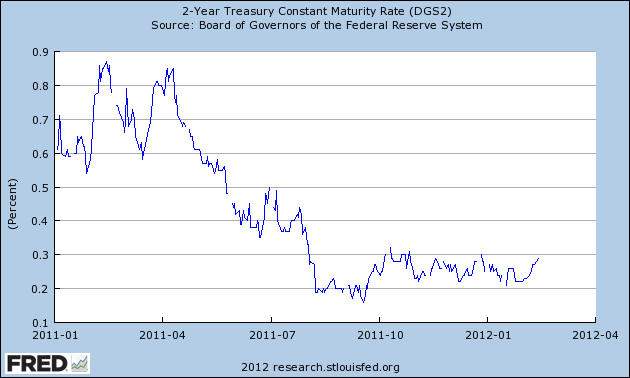
In particular, Swanson and Williams found that the 2-year yield continues to have at least some response to basic news releases, which could signal that investors aren’t fully persuaded by the FOMC’s declared intention to maintain “exceptionally low levels for the federal funds rate at least through late 2014.”
The 2-year yield didn’t budge when the strong January employment report was released, though it’s been creeping up a few basis points in the two weeks since then.
|
It makes more sense to me to apply the approach from Krippner (2011) to obtain the shadow yield curve. You could estimate a VAR on some key economic variables and then plug in the shadow short-term yield to get an idea of what the performance would be like if rates would have been at their shadow levels.
When Germany, Switzerland, and the UK auctioned bonds with yields less than zero, the WSJ mentioned that this was explicitly prohibited by the auction design in the US. Given that cash does not appear to provide a lower bound in those countries, what is the effect of providing an interest rate floor in the US? The yields haven’t been substantially below zero, so is the impact negligible?
For reference, here is the WSJ article from 1/10/2012.
“In a period of deleveraging such as the U.S. has been going through, it is possible for the natural rate of interest to become negative.”
It’s not the deleveraging. People need to understand what a natural rate of interest becoming negative truly means.
“This lower bound of zero on nominal interest rates can put a constraint on the ability of the economy to self-correct or the Fed to provide stimulus in such a situation.”
Only if you believe all new medium of exchange has to be borrowed into existence?
Get Rid of the FED,
Can you tell us “what a natural rate of interest becoming negative truly means?”
Ricardo, let’s have some time for people to respond.
So does this mean we should find a disconnect between returns on corporate bonds and equities, which do still seem to respond to news releases, and yields on government bonds?
Congratulations to Cynthia on landing a nice job. I guess that means JDH will have to find another unsuspecting grad student to maintain that data base on treasury maturities!
I can’t help but wonder if US Treasury rates are a reliable means of determining anything about the US economy.
Though the period before the Fed [pre1914] was marred with all kinds of govt distortions to money & banking, the period was relatively more characterized by market-generated interest rates than since the Fed was instituted to fix rates.
Can anyone produce evidence of a period of any duration where negative real interest rates prevailed other than during Lincoln’s ‘Civil War’, when like today money printing ruled?
Bryce Who is talking about “negative real interest rates”? Today’s problem is exactly the opposite. The Wicksellian market clearing interest rate is negative. The problem is that the market cannot get to that desired negative Wicksellian interest rate because of the zero lower bound. In other words, the market “wants” a negative interest rate, but since people can always choose to hold cash rather than negative interest rate bonds, interest rates cannot break through the zero floor.
Negative real interest rates happen when inflation is high. Negative Wicksellian interest rates are a phenomenon of deflation. And that’s one reason why a little bit of inflation (say 4%) might not be such a bad thing. It would likely lift the Wicksellian interest rate out of negative territory and give the Fed’s FOMC operations more traction. The risk is that 4% inflation leads to 5% inflation, which leads to 6% inflation, etc. That’s a risk, but less than the downside risk of deflation. The two risks are not symmetric.
One thing about the pre-Fed days of the 19th century that “Atlas Shrugged” types often forget is how state governments reacted to the extreme swings in interest rates and prices. For example, following the Panic of 1837 the price level fell 46%, which created a huge burden on debtors. The federal government took a very Ayn Rand friendly position; but state governments acted like the Politburo. State governments passed all kinds of pro-debtor laws that even Occupy Wall Street types would consider too extreme. So it’s important to keep real history in mind rather than some imagined idyllic history.
Well, putting a million in the drawer does not have an expected return of a million. Theft or fire, or someone mistakingly selling the desk with the drawer does happen. A sequrity box in a vault will cost you money.
Ricardo, enough time seems to have past. Not many comments.
imo, a natural rate of interest becoming negative truly means that the economy has gone from mostly supply constrained to mostly demand constrained, CONTRARY to the one of the definitions of economics (unlimited wants and limited resources) and almost all economists’ most prized assumption, real aggregate demand is unlimited.
That should stir up a hornet’s nest!