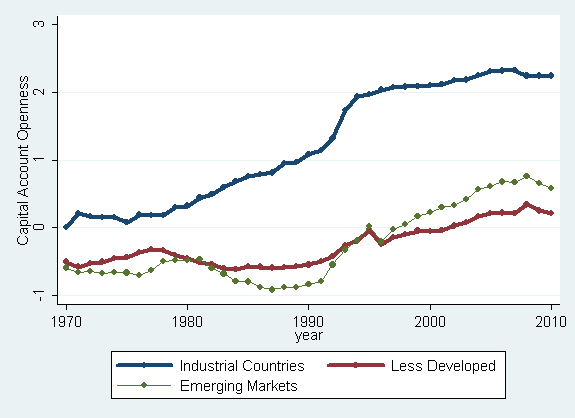
The Chinn-Ito KAOPEN index — a measure of de jure financial openness — has just been updated to 2010 (site here). The results show some slight retrenchment in recent years, particularly in LDCs and emerging markets, as shown in Figure 1.

Figure 1: Evolution of KAOPEN for Different Income Groups. Source: Chinn-Ito.

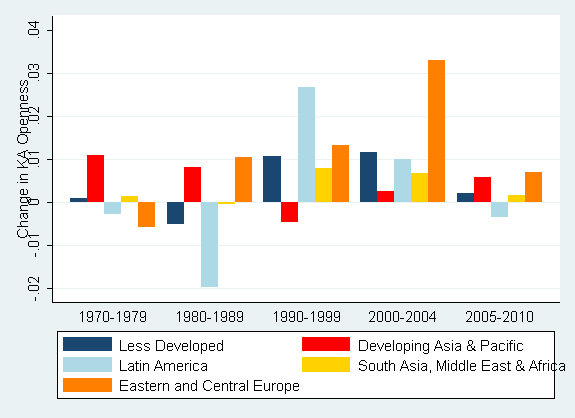
Figure 2: Change in KAOPEN among geographical groups of developing countries. Note: The change in KAOPEN is shown as the change in the normalized KAOPEN (max=1.00). Source: Chinn-Ito.
This index was discussed previously in this post. It’s been used in various studies, including the 2009 World Development Report.
A recent article by Dennis Quinn, Martin Schindler and A Maria Toyoda compares the various extant financial openness indices.
A random walker in the financial openness world, may notice Croatia to be ranked in the top 960.This country is coming as a close challenger to several countries belonging to the European zone.Not to challenge the “business models” of the European universe,it would be very interesting in the case of Croatia,to be appraised with the key drivers of its membership to the European zone.Is the judicial system transparent,are the judges moved from time time from their native towns to other townships,the same for the police?.Are the state laws and regulations in compliance and enforceable.Are the state laws applicable to the whole country.Is it possible to find a lawyer in case of litigation with the local authorities,in case of litigation with the autochtones.Is the police operating as an independent arm of the state system.Are the controls on money laundering in compliance with the international standards.Is Croatia in compliance with the basic international regulations?
My documented answer NO.
It would be interesting for the European citizens and others,to be appraised with the critical paths of accession of each country to the European community and progress reports to be divulged and accessible.
The color graph is way over the top. Almost impossible to follow; it’s a just a riot of color.
I would have grouped the areas and then shown the changes for each area over time. But pretty much any other arrangement would be better.