I have found it somewhat surprising that analysts have worried about how employment growth has recently outpaced GDP, according to Okun’s Law, while others have bemoaned the slow pace of employment growth [0] [1]. Underpinning these discussions is a view that there is instability in the relationship. [2] The first thing to recall is that there are several versions of Okun’s Law. Some are expressed in levels, some in deviations from natural levels (gaps), and some in growth rates. From Figure 1, it does appear that private employment growth has been above expected, after being below expected.
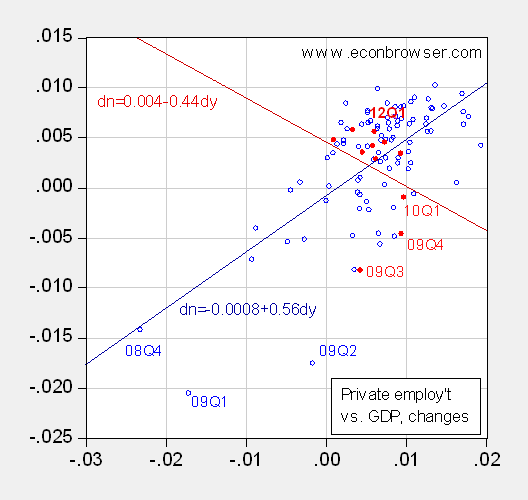
Figure 1 shows the growth rates of private employment against GDP over the 1987Q1-2012Q1 period — essentially the period of the Great Moderation.

Figure 1: Quarter on quarter growth rate of private nonfarm payroll employment against GDP, 1987Q1-2012Q1. Red circles denote observations during the most expansion period. Quarterly employment figures are averages of monthly figures. 2012Q1 observation is average of January and February for employment, and GDP is 2.4% SAAR (Macroeconomic Advisers forecast 3/30). Source: BLS via FRED, BEA, 2011Q4 3rd release, and author’s calculations.
Notice that from 2008Q4 onward, employment growth was below the regression line (i.e., employment was underpredicted), and continued on into the recovery period. The most recent observations have indeed been above the regression line. But there does seem to be a consistent pattern wherein contractions are associated with employment growth below that implied by the relationship that obtains over both upswings and downswings.
This suggests to me that we don’t want to look at static relationships (levels on contemporaneous levels, or growth rates on contemporaneous growth rates), but rather dynamic ones. And perhaps ones that allow for different behavior in contractions (after all, GDP business cycles are not symmetric – contractions are shorter than expansion). (This is on top of the instability noted by Duy.)
To assess whether accounting for these issues matters, I estimate three specifications including private employment and GDP, over the 1987Q1-2007Q4 period:
- A first differences specification (with one lag of first differences, GDP assumed exogenous) .
- An error correction specification (with one lag of first differences, GDP assumed exogenous).
- An error correction specification, incorporating a dummy variable for GDP contraction.
The regression results, diagnostics, and stability tests are here.
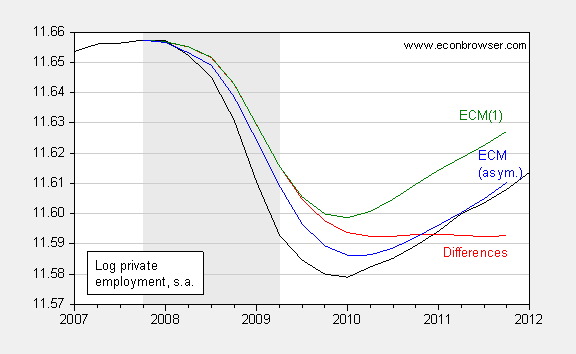
The dynamic forecasts (these are formally known as “historical simulations” since the ex post path of GDP is used) are displayed in Figure 2.

Figure 2: Log private nonfarm payroll employment (black), dynamic forecast from first differences specification (red), from error correction model (green), and from error correction model with contraction dummy (blue), seasonally adjusted. Quarterly employment figures are averages of monthly figures. Source: BLS via FRED, NBER, and author’s calculations.
The first thing to note is that a first differences specification, which focuses only on growth rates, and omits any long run tethering between GDP and employment, captures the decline in employment but fails completely to capture the rebound. (This occurs because the forecasted level of lagged employment is used to generate the forecasted current level of employment, rather than the actual lagged employment level.)
An error correction model fails to capture the entire decline in employment, but does track the general contours. Notice that in Figure 1, employment growth is underpredicted during recessions and early portions of the recovery. I include a dummy variable for recessions into the error correction model (and add in a second lag of differenced GDP, to obtain an adequate fit). This results in a forecast that follows the actual trajectory of employment.
Hence, with both the GDP revisions and employment revisions, one can model employment growth fairly well, as long as one takes dynamics seriously, and includes an estimated long run relationship.
Menzie,
I’ve estimated a similar error correction model for payrolls with real GDP, temp employment and overtime hours in my cointegration vector. The model suggests that upwards of 25% of all job creation since 2010 has come as a result of the error correction mechanism as employment catches up to levels consistent with the level of real GDP. Interestingly, the model also suggests that payrolls will increase at a rate of 200K+ per month in the q2 as the boost from the error correction mechanism more than offsets any downward bias associated with business activity slowing as the effect of an unseasonably warm winter dissipates. The recent strength in payrolls is not simply a weather story. Look for changes in payrolls to remain robust through the spring.
Okun law is the relationship between a decreasing unemployment and GDP growth,the stability of the relationship does not question the quality of the GDP,neither does the paper of T. Duy seems to raise questions on the nature of the output gap filled or to be filled.What if the financial components of a GDP, or the financial components of an output gap would require less employment,to produce the same “output”.
How to measure accurately the evolution of “financial” GDPs?
Menzie I’m puzzled by the constant in the three regression results. The simple difference regression has a small but statistically significant negative constant, implying a downward trend since this is all in differences. The two ECMs have small but statistically significant positive constants. And the last two are of similar magnitude. Is there an argument here for not including a constant?
John Anania: A dynamic forecast using a VECM with two lags and the contraction dummy implies at least 200,000 monthly net (private) job creation throughout 2012. The forecasted GDP growth is at least 2.8% SAAR throughout 2012.
2slugbaits: The regressions in the scatterplots are descriptive. The first difference specification and the ECMs I hope are more structural; imposing a zero constant, particularly in the ECMs, imposes constraints on the error correction term and drift term that one would want to test for.
Dear Menzie,
Thank you very much for this post. I hope to do some research on Okun’s Law later this year, and this is a useful starting point, so I may quote it if I can.
I will give you one point you might think about, and save the other for later. Okun’s Rule in the traditional form is a log-log relationship in essence: % increase in real GDP = constant * % drop in unemplyment if you aren’t at full employment. How confident are you that this functional form holds? What would you regard as a legitimate test against linearity in the levels as a relationship?
Julian
I became interested when ECRI made their recession call in the relationship between GDP and GDI. At the time of their call ECRI argued the stagnation in GDI was more relevant than GDP. Since then I have learned that GDP revisions tent toward the GDI number, and the GDI number has since improved.
Would using GDI instead of GDP change the results?