Updated 5/27 — added Figure 2 showing Wisconsin’s poor performance vis a vis US as measured by coincident indices.
Governor Walker has been touting on numerous (!) radio and television ads employment gains using the Quarterly Census of Employment and Wages (QCEW) based figures [0], and (apparently) adding on reported changes in employment, as recorded by BLS. I wanted to highlight exactly how lackluster the record looks even with Governor Walker’s preferred numbers.
First note that Walker cites the 23,321 increase over 12 months ending in December (so, starting before Governor Walker’s inauguration in January), and adds to it the BLS estimate of NFP employment growth from December 2011 to April 2012 of 12,200, to obtain a 33,000 total increase [1] (I actually can’t figure out how they get that number, but close enough…).

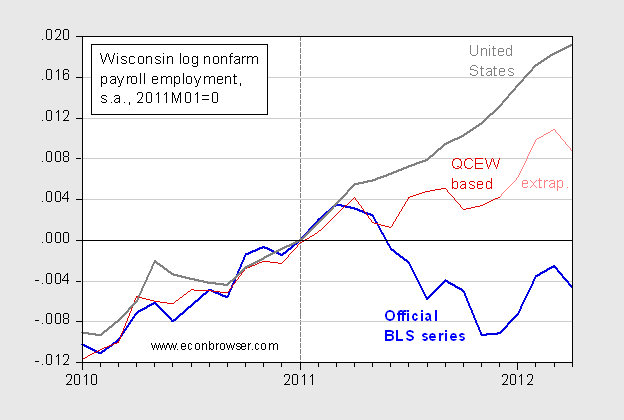
Figure 1:Official BLS Wisconsin log nonfarm payroll employment series (blue), US log nonfarm payroll employment series (gray), and QCEW-based estimates of NFP, see text (red), and spliced BLS series from Jan-Apr (salmon), all normalized to 0 at 2011M01. Dashed line at 2011M01. Source: BLS (April release), BLS (April release) via FRED, author’s calculations.
From April through December 2011, Wisconsin seemed detached from the national trend, even using the QCEW-based figures, such that by 2011M12, Wisconsin cumulative employment growth was almost a percentage point below the nation’s. Splicing the BLS series to the QCEW-based series, one notes that in April employment is declining, so that cumulative Wisconsin employment growth is now over 1 percent below that of the nation’s (in log terms). So if one thought US employment growth was lackluster, how to characterize Wisconsin’s?
And, as noted previously [2] [3], Wisconsin employment is lagging far, far behind the smooth path implied by Governor Walker’s 250,000 increase in private employment.
Further note that the DWD figures Governor Walker repeatedly cites (October-December 2011) have not been cleared by BLS, so remain provisional, insofar as benchmarking the NFP series is concerned.
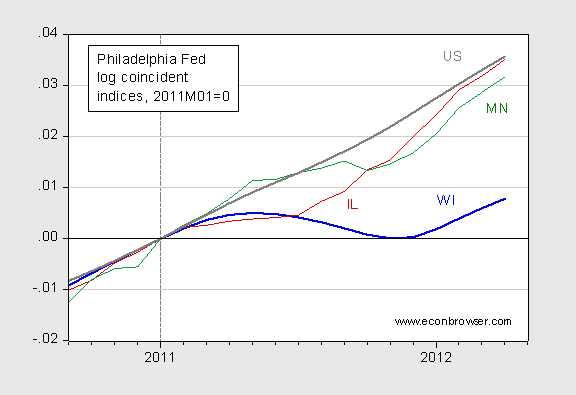
Update 5/27 9:40PM Pacific: Reader Adjoining states asks to see how Wisconsin compares to Illinois and Minnesota. As figure 2 below shows, according to the Philadelphia Fed’s (log) coincident indices, not good. This holds even truer if one does not normalize to 2011M01.

Figure 2: Log coincident indices for Wisconsin (blue bold), Illinois (red), Minnesota (green), and the US (gray bold). Source: Philadelphia Fed coincident indices, April release.
Let me get this straight. Unemployment in WI has fallen in the past month in all but one county and thirty of the largest cities, and that’s bad? Unemployment is all Walker’s fault, and there can be no other cause? A cause like terrible unsettled politics has no effect and even it it did it would still be Walker’s fault for the unsettled politics? Is that your message?
CoRev: My message is that Wisconsin nonfarm payroll employment growth and private payroll employment growth, using official BLS estimates, or even using Governor Walker’s estimates, is modest, and is modest even by comparison to US national employment growth, which many critics have pointed to. Growth even using Governor Walker’s alternate numbers remains far below the path laid out in his unconditional 250K jobs by 2016 promise. That is all I stated in the post. You drew up your own inferences.
Jesus Menzie, give IT a break.
You afraid that Walker might make you college slackards work a little harder by teaching an extra course or two?
Menzie says: “That is all I stated in the post. You drew up your own inferences.” If this were a singular post with no past posts, then your comment would make sense. However, it is far from the only post and the history is from which the inference is made, and you still have not answered my question. Isn’t WI unemployment still well below the national average? If the rest of the nation is having trouble establishing new jobs, why would WI, already better off, be expected to match the nation?
You also don’t have to be a brain surgeon to recognize that President Obama’s forecast that unemployment would not rise above 8% was wrong.
Wow, as an avid novice follower of the economy and banking (via mostly blogs and a few books) since I first started reading calculated risk in the spring of 2007, I must say, while I very much appreciated your posts Dr. Chen, the comment section is much more entertaining. I am fancinated by the literal disconnect from facts that is exibited by some of your, how should I put it, “anti-fans”. It seems there is a religious zeal driving their attacks. They are unrelenting in their refutiation of anything you post, no matter how absurdly simple the underlying numbers are to interperet… I salute you sir!
I’m also pretty surprised by the comments on this post. It’s just data people! Gov. Walker’s own estimates show him coming up short on his promise. That’s the article. Infer all you want from this, but thems the facts.
CoRev: So let me repeat what I have said again and again about WI unemployment (but apparently to know avail); essentially there is a WI state fixed effect that has been in place for at least a couple decades, wherein WI unemployment is about a percentage point below the US.
Menzie said: “there is a WI state fixed effect …, wherein WI unemployment is about a percentage point below the US.” And that’s a good thing.
But why are you assigning responsibility to Walker for not achieving better performance, when it clearly is a shared responsibility. If WI is consistently below US averages, and WI performance under his leadership is even better than the normal differential why is it not OK. Is he supposed to make WI achieve better performance than the nation? How?
CoRev Ugh! If I play in tonight’s NBA game and score 2 points, that would be a great game for me. If Lebron scores 15 points that would not be a good game for him. What is a good performance for everyone else is not relevant when comparing Lebron’s performance to his past history.
In a fixed effects panel data analysis it’s assumed that the slope of the pooled OLS regression line is the same as the slope for each of the panel groupings. What’s different with each panel grouping is the intercept. What Menzie is trying to explain to you is that Wisconsin’s employment growth slope is flatter than the pooled OLS slope and flatter than other states. We would expect Wisconsin to have a lower overall unemployment rate because the intercept for Wisconsin is lower…that’s a fixed effect.
This has become comical.
Your rent seeking ulterior motive is showing.
Rent seeking. Lol. And union thugs are not rent seeking? And you liberal loons are not rent seeking? Give me an effing break. If the data doesn’t lie, why not give the full picture? I don’t applaud Walker for stooping to your level, but what do we expect these days. Goodness.
Here’s an interesting commentary on these repeated posts…
What are economists for, anyway?
(http://ineteconomics.org/blog/inet/what-are-economists-anyway)
The first line of the second paragraph seems poignant.
“The answer seems clear-cut. Economists today primarily serve the needs of powerful interests at the expense of society in general.”
and
“…those whose visions aligned with powerful financial interests “were used as marketing vehicles, and they were not adequately skeptical as scientists of what the flaws in their vision might be.”
It’s been eye opening to see how a college professor of economics has been single-minded in negative posting of Wisconsin’s governor of the last 17 months.
Lets see…
*state taxes are steady or down for the first time in 8 years
*There were so many educational cuts in previous years that the WEA (teacher’s union) pulled the data about these cuts from their website when it became clear that Walker’s 1st year of reforms looked unbelievably stellar in comparison.
In other words, he is providing intellectual sniper cover for the ongoing abuse of the power of public unions on an unsuspecting public. Sigh. If he didn’t live in the state, I suspect that his analysis and interpretation would be more fair and balanced.
http://www.jsonline.com/news/education/weac-walker-at-odds-over-surveys-release-1m4vtqf-147268665.html
J: I believe it would be more useful if you highlighted something factually, numerically or analytically wrong in my posts, as opposed to merely criticizing the messenger. The fact that you don’t suggests you do not have any fact-based critique.
“If WI is consistently below US averages, and WI performance under his leadership is even better than the normal differential why is it not OK.”
In the data provided, WI is now doing worse than the rest of the country. How do you get that the performance is even better? Are you misreading this as unemployment?
Steve
Dr.Chen: how is WI performance compared to union friendly, tax increasing IL and their close cousin MN?
Adjoining states: Wisconsin is 2.7% and 2.4% below Illinois and Minnesota, respectively, according to the Philly Fed coincident indexes (in log terms, normalized at 2011M01=0).
Menzie Iowa and Michigan are also adjoining states, and they also rank above Wisconsin in the Philly Fed index.
2slugbaits: Yes, I just didn’t feel like downloading all those series. You get the feeling in this post, for Adjoining states benefit.
Thanks, Dr. Chinn. I am not an economist. So can’t really see the non farm payroll in IL and MN from the coincident indices. Is it possible to see NFP in those states to see apples to apples comparison to your first graph?.
Adjoining states: I didn’t plot that, but NFP is a component of the coincident indices, which I use as a broader measure of activity. You can download the state NFP series yourself from BLS.
Thanks Dr. Chinn…I took a look at FRED data on NFP in these states..they do confirm that WI is trending below the adjoining states. You have a point here. Thanks again.