Or, are there nonlinearities in the real (macro) world?
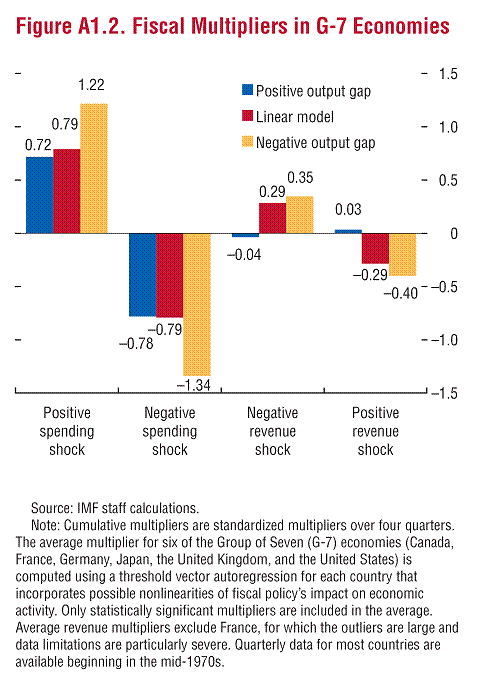
Following up on Jim’s Sunday post on multipliers, I found this graph from the April IMF Fiscal Monitor of interest:

Figure from IMF Fiscal Monitor, April 2012.
The authors describe the results underpinning this graph thus:
The model finds significant evidence that the impact of fiscal policy on economic activity varies with the business cycle and that the effect of fiscal policy on output is nonlinear. Average fiscal multipliers in G-7 countries are significantly larger in times of negative output gaps than when the output gap is positive (Figure A1.2). Results from a simple linear model are very much in line with averages identified in the previous literature, as shown in Table A1.1. Assuming, in line with recent fiscal adjustment packages in advanced economies, that two-thirds of the adjustment comes from spending measures, a weighted average of spending and revenue multipliers in downturns yields an overall fiscal multiplier of about 1.0.
In line with the bulk of the previous literature (including the survey by Spilimbergo, Symansky, and Schindler, 2009), short-term spending multipliers are found to be significantly higher than revenue multipliers. This can be explained with basic Keynesian theory, which argues that tax cuts are less potent than spending increases in stimulating the economy, since households may save a significant portion of the additional after-tax income. (p.35)
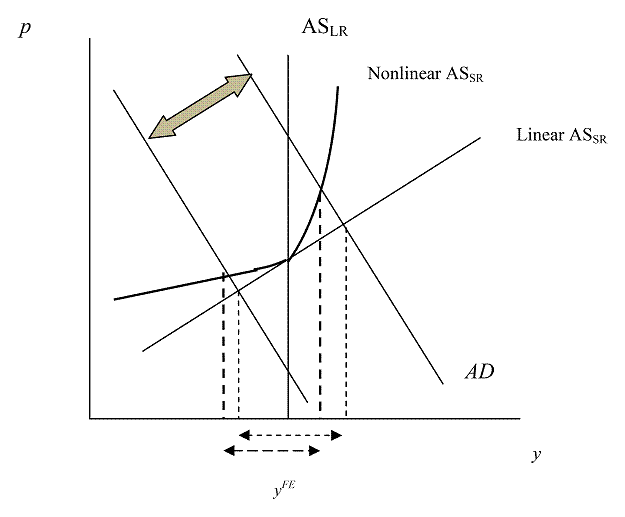
The idea of nonlinear responses makes sense to me. In the context of the standard aggregate demand/aggregate supply framework, the distinction can be illustrated as follows:

Figure 1: Linear (in logs) aggregate demand and linear aggregate supply vs. nonlinear/kinked aggregate supply curve.
Note that variability in aggregate demand (AD) around potential GDP, yFE, (denoted by the gray arrow) induces smaller increases in output when above full employment than below. (This by the way reminds me of a 1995 paper by my coauthor Guy Meredith, with Doug Laxton, documenting asymmetry in inflation adjustment to slack. In other words, this idea has been around for a while).
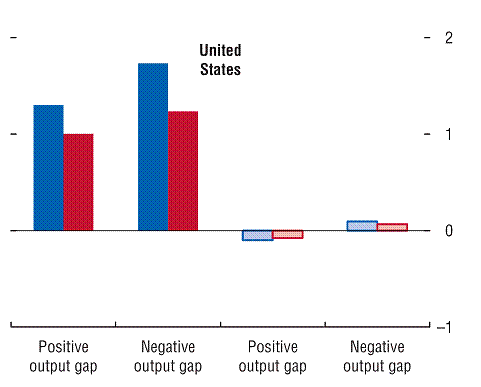
What I find of interest are the US results.

Excerpt from Figure A1.3 from IMF Fiscal Monitor, April 2012. Left side bars are for positive spending shocks at 4 and 8 quarters; right side bars are for negative revenue shocks at 4 ad 8 quarters.
In other words, government spending has large output effects, particularly in the presence of a negative output gap, once nonlinearities are allowed. Tax revenue changes have much smaller impacts (which are nonsignificant statistically in the linear specification).
Similar results are obtained by Auerbach and Gorodnichenko (AEJ:EP, 2012) (ungated version), who use a similar methodology:
Our findings suggest that all of the extensions we developed in this paper—controlling for expectations, allowing responses to vary in recession and expansion,
and allowing for different multipliers for different components of government purchases—
all have important effects on the resulting estimates. In particular, policies
that increase government purchases have a much larger impact in recession than is
implied by the standard linear model, even more so when one controls for expectations,
which is clearly called for given the extent to which independent forecasts help
predict VAR policy “shocks.” Given the historical experience of the US economy, our preferred estimates of the government spending multiplier are between 0 and 0.5
in expansions, and between 1 and 1.5 in recessions.
One interesting implication of these results, beyond the fact that further spending cuts now would be disastrous, is that the hundreds of billions of stimulus during the 2004-08 period –- during which the output gap was slightly positive — could have been better spent now. (After all, publicly held Federal debt increased by $3.4 trillion going from 2001Q1 to 2009Q1.)

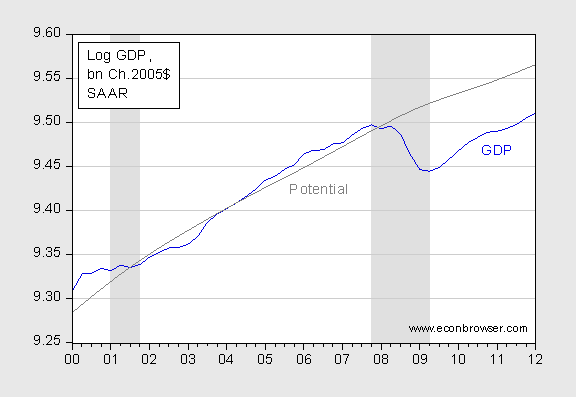
Figure 2: Log GDP (blue) and log potential GDP (gray). NBER recession dates shaded gray. Source: BEA, 2012Q1 advance, and CBO, Budget and Economic Outlook, Jan. 2012, and NBER.
Or, as I wrote nearly six years ago:
What we can be certain of is that the choices made by policy makers in the past five years have circumscribed our ability to manage a downturn.
Update, 5/23, 7pm Pacific: Steve Fazzari, James Morley, and Irina Panovska have just written “State-Dependent Effects of Fiscal Policy”:
…The response of output to spending shocks depends strongly on the regime. The shock to government spending pushes output up immediately in both the high and the low utilization regimes. However, in the low regime, output rises almost monotonically to a cumulative change in output equal to 1.6 times the cumulative change in government spending. Most of the effect takes place in the first three years. In the high-utilization regime, the pattern is substantially different. After the initial positive response, the cumulative change in output falls back towards zero. The long-term response is positive, but the multiplier is less than half of that when output is in the low-utilization regime.
In this case, where the threshold is estimated, the economy spends roughly half the time in the high-multiplier regime.
But wasn’t there a supply shock. Prices increased incredibly from 2005 to 2008.
We had two supply effects, people borrowed 2005-2008 with the expectation that prices would revert to the mean and salaries would rise as promised.
We it was clear that we were mistaken, demand fell to where it should have been (and then some for some assets like houses).
How much of that potential GDP is based on deficit spending (for households, treasury, and corporatations)?
What seems to be forgotten is that during the 2005-2008 time period, interest rates increased dramatically (between 2005-2007). Most of the increase in borrowing during that time by households was to finance existing debt payments (credit cards, HELOC’s, ARM’s). In my estimation the reversal of interest rate policy during a time of large amounts of consumer-held variable rate debt pushed consumer demand off of a cliff in 2008. Thus the end of the housing bubble and the collapse of aggregate demand.
Amazingly, conservative economist Mark Perry partially agrees with you.
http://mjperry.blogspot.com/2012/05/no-1-barrier-to-small-business-success.html
“Given the historical experience of the US economy, our preferred estimates of the government spending multiplier are between 0 and 0.5 in expansions, and between 1 and 1.5 in recessions.”
We have been in an expansion since June 2009.
+1000 for Steven.
“We had two supply effects, people borrowed 2005-2008 with the expectation that prices would revert to the mean and salaries would rise as promised.”
I guess that should read “demand effects”.
Steven Kopits: In Auerbach and Gorodnichenko, recessions are when F(z) > 0.8, where z is 7 qtr moving average of the growth rate (which therefore leads to different timings from NBER categorizations, according to Figure 1 in the published paper). Not sure where we are now.
In the IMF study, it’s whether have a negative output gap; I think everyone agrees with that.
Menzie, doesn’t the debt run-up suggest that we were over-producing prior to the crisis and that the output gap is probably a bit smaller than we calculate?
Or put another way, was the growth leading up to the crisis mostly due to valuation changes sustained by increasing debt?
Obama says we are in an expansion and that he has created 4 million jobs. Menzie believes/worships everything Barry says (I probably would too if I were a public-sector employee sucking at the public trough while teaching only two or three courses a year), so we must be in an expansion…
Soaring debt, no REAL jobs, higher future expected taxes, soaring current and future expected energy prices, soaring healthcare costs….all brought to us by nOBAMA and the Dems….don’t matter! All that matters is the fantasy that is Keynesian SPENDING multipliers…..
With Obama we can all be GREECE!
Note that from 2004-2006, we also had the Fed funds rate increased from 1.0% (6/2004) to 5.25% (12/2006).
If stimulus was excessive, then maybe the Fed should have just let the resulting inflation occur, instead of tightening. Had they done this, not only would rising inflation and longer term rates likely have reduced incentives for excessive lending in housing markets, but practically every true Keynesian would have then been calling for sharp cuts in government spending.
Bottom line, the Fed caused liquidity trap conditions through excessive monetary tightness. If fiscal policy is inflationary, then maybe the Fed should allow some inflation to occur, and allow fiscal policy to make the adjustment.
Keep in mind, we had a pretty significant demand shock back in 1999-2002, with the fall in equity markets, but the Fed at that point had plenty of room to maneuver, and we had a relatively quick recovery. And equity markets recovered as well, from 2003-2007.
aaron BEA says that real chained (2005) GDP for 2007 was $13,206.4M. According to CBO real chained (2005) potential GDP for 2007 was $13,193.4M. In other words, actual GDP was about 0.1% greater than potential. I call that a rounding error.
Rather than politics, which is a repetition of existing bias, the question presented in these two posts is really interesting.
First we had a linear presentation, one that takes all the quarterly GDP data and looks at the results if you make a bump (excess spending scaled, etc.). This one view of reality. It’s valid from that view. Now we have a second view, one that looks at non-linear issues, which means we’re looking more closely at specific periods within the long line of GDP. Despite what JDH noted in a comment on the last post, I would be amazed if the linear view simply held true at all scale levels. (I’m not entirely sure this is an accurate description of his comment; he noted a doubt about finding non-linear effects but he may have been referring to such effects at that level.)
This is a real issue that pervades economics. It has no specific, physical thing that guides all discussion as, for example, evolution of the nose is always drawn to and around the physical thing of the nose. With economics, you have to pick a perspective. No one choice covers every view. It’s just not possible. This allows people to buttress their biases while claiming they speak an absolute rather than a relative truth. It also means economics writing tends to overstate importance and understate limitations, something which is just not done in the hard sciences. I find it amazing that I have to pick through bits of papers to find what they didn’t want to talk about, possible objections, etc. It’s way too much presenting a point of view, almost always coupled with regressions whose equations are listed but whose content tends to be glossed over or expressed in jargon whose intent must be to prevent challenging interpretation (or which express a lack of understanding of the ideas behind the math).
One example of distortion is the repeated remarks about stimulus in comments. It can be said over and over and over that 38% was tax cuts and that these amounted to perhaps the largest tax cut in US history – about $300B concentrated in a short period (and then even extended so they’re larger). If the stimulus didn’t work, what does that say about the efficacy of tax cuts? What does that say about claims tax cuts raise GDP? And to be clear, it seems from data analysis that tax cuts can raise GDP.
I sometimes think the problem is buried in the way economics uses words. We hear “crowding out” and think it means literally pushed out when it tends to mean influencing choices, as in the study noted on an Economist blog about charitable spending by religious organizations dropping in the 1930’s as the government started to spend. There was plenty of need but they chose to switch and that is “crowding out.” At a deeper level, economics defines “empirical” in a similarly odd way: it’s generally statistical analysis of data instead of observation meaning it’s perspective driven extrapolation from data instead of the gathering of data. That’s incredibly weird when you think about the word.
The debate about multipliers can’t be settled. It’s driven by perspective, both in data analysis and politics.
Why isn’t the AD curve horizontal for countries with an inflation targeting central bank?
It is amusing that after 81 years Richard Kahn’s Keynesian myth is still being debated and no one can even define it, much less determine whether it is positive or negative. And yet main stream economists and our government persist in establishing policies based on a fantasy. Most good econometrics demonstrates that the fiscal multiplier does nothing at best, but can be very destructive at its worst. If it is negative why do we persist in policies that have a negative effect? Blind faith comes in many forms.
Reading the outcome of the IMF paper , ”The effectiveness of fiscal policies in stimulating economies A review of the literature” supplies a large variety of interpretation of the effectiveness of not only fiscal policies, monetary policies and government spending (P20) but it cast doubts as well on the accuracy of the standard multiplier evaluation. Strangely Japan fiscal multiplier, government spending is very lightly addressed, when it captures the nowdays reality of Europe and the USA.
Update 5/23 7pm Pacific: Addition of link to paper Fazzari, Morely and Panovska, “State Dependent Effects of Fiscal Policy”.
Menzie The Fazzari et al. paper uses a VAR in first differences with four lags, although they say there is no cointegrating relationship; however, the time series are all difference stationary. The Ramey paper used four lags in levels, and presumably that data was also nonstationary. Four lags of differenced data is “equivalent” to five lags of levels, and four lags of levels is “equivalent” to three lags of differenced data. The VAR literature seems divided on this, but in your opinion (and JDH‘s), when dealing with nonstationary data in a VAR, is it more appropriate to use levels or first differences? Is the answer the same for recursive VARs versus structural VARs? Would it have mattered in either one of the papers?
I’d like to see the same study done, but look at the multiplier and treasury rates.
Since we know small government is best for growth, and we know that little spending stimulus gets done during recession (most, maybe almost all, was done after we were already in expansion), I think a policy of tax rates tied treasury rates would make a great automatic stabilizer.
Perhaps we could come up with something along the lines of an interest ceiling rather than a debt ceiling.