Here I describe some interesting new research on modifying Hubbert’s model of peak oil to take into account the incentives for additional production that higher oil prices would be expected to bring.
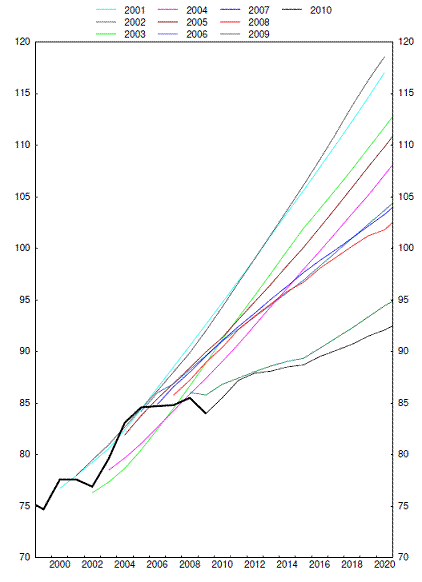
A recent IMF Working paper by Jaromir Benes, Marcelle Chauvet, Ondra Kamenik, Michael Kumhof, Douglas Laxton, Susanna Mursula and Jack Selody begins by noting the trend in forecasts of oil production from the U.S. Energy Information Administration. In earlier years, these forecasts were primarily just extrapolations of trends in global demand, with the assumption that supply would grow as needed to meet demand. If EIA’s 2001 forecast had proven accurate, the world today would be producing about 100 million barrels of oil each day. The EIA forecast for 2012 has been revised downward in each successive year, and now stands just under 90.
 |
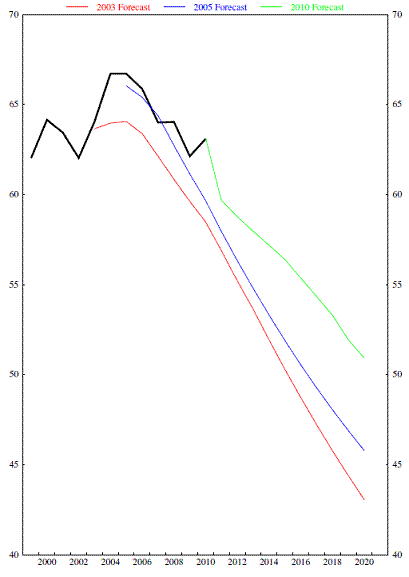
The IMF researchers note that although forecasts based on mechanical extrapolation of trend have done badly, so too have the pessimistic forecasts of geologist Colin Campbell, who expected his definition of conventional oil production to have fallen much more rapidly than has actually been observed.
 |
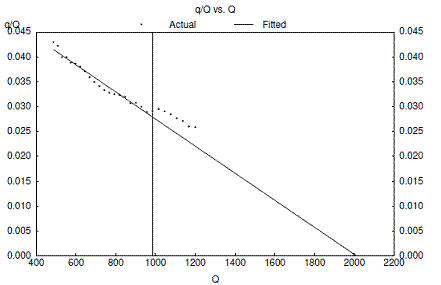
Likewise, Kenneth Deffeyes’ (2005) widely cited adaptation of King Hubbert’s (1956), (1982) approach predicts a linear relation between total cumulative production (Q on the horizontal axis below) and the ratio of current to cumulative production (q/Q on the vertical axis). This too has proven too pessimistic, as production in recent years has been higher than such a relation would have predicted.
 |
Another recent paper by University of Calgary Professor John Boyce documents a systematic track record of misses of the Hubbert-Deffeyes model, with the set-up ex post proving to have been too pessimistic when estimated for a variety of different data sets and sample periods. Boyce also notes that fitting analogous relations to agricultural production would lead to a prediction that production of each of 21 different crops is headed to eventual exhaustion, and notes that a variety of fully sustainable increasing production paths would appear to imply imminent resource exhaustion when confronted with the Hubbert-Deffeyes’ methodology.
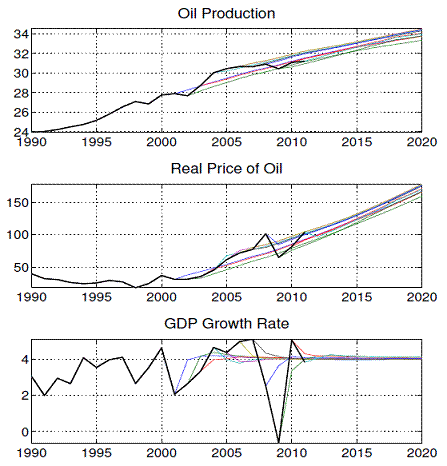
The IMF team propose modifying the Hubbert-Deffeyes model to allow for a response of supply to the price of oil, where higher oil prices will (with a lead time of 4-6 years) stimulate higher production levels. They combine this with a traditional model in which demand for oil depends on growing GDP and the price of oil. The model strikes a compromise between the EIA and Hubbert-Deffeyes approaches, and has a better track record than either in simulated out-of-sample predictions over the last decade.
 |
The IMF model predicts that growth in demand will put continual upward pressure on price, with the inflation-adjusted price of oil headed for $180/barrel by the end of the decade. According to their estimates, those price increases would be sufficient to keep global production increasing at about the same reduced rate we have seen since 2004.
My view is that the IMF researchers’ approach is clearly better than the simple Hubbert-Deffeyes linearization, but may still be subject to some of the other problems documented by Boyce (2012), as well as the familiar challenges of statistically distinguishing supply and demand effects. Notwithstanding, the IMF research should help raise awareness of an issue that remains underappreciated by many economists, which is that we will eventually reach a point, and may have already, at which quite significant increases in price and improvements in technology can produce only modest increases in production, or may be insufficient to prevent outright declines in annual crude oil production levels. For those still in doubt about that possibility, I would again call attention to Pennsylvania, the place where the oil industry began in 1859. The price of oil today is 5 times as high in real terms as it was in 1891, and of course there have been tremendous technological advances in the century since then. But the state produced 8 times as much oil in 1891 as it does today.
 |
We like to think that the reason we enjoy our high standards of living is because we have been so clever at figuring out how to use the world’s available resources. But we should not dismiss the possibility that there may also have been a nontrivial contribution of simply having been quite lucky to have found an incredibly valuable raw material that for a century and a half or so was relatively easy to obtain. Optimists may expect the next century and a half to look like the last. Benes and coauthors are suggesting that instead we should perhaps expect the next decade to look like the last.
Welcome to the natural gas century.
That’s a very nice presentation of the topic.
I seem to recall from the IMF paper that they expect ongoing price rises in the range of 7% per annum. My estimates, based on a carrying capacity approach, come out at 6-8% / year. So we seem to be in agreement on that, although it might be just coincidental.
Now, as I have stated before, the issue is the rate at which E&P costs will rise. These have been going up at 18% per annum. I spoke to the head of strategy for one of the big OFS firms, and this topic is now on their radar, too, as this may affect upstream capex budgets and spend on oil field services.
We’ll touch on this issue at the oil symposium on June 19th in New York.
I’m always amused at how many peak oil dates there have been for the past half century.
Wasn’t there a peak food point a couple of centuries ago?
The issue is always “conventional” sources. The USGS points out an huge unconventional source that has yet to be tapped:
http://marine.usgs.gov/fact-sheets/gas-hydrates/title.html
…at least by the U.S.
http://www.guardian.co.uk/business/2010/sep/27/energy-industry-energy
Today’s “unconventional” is tomorrow’s “conventional” which is why “peak” is meaningless.
Nice post. Years ago, when first running into the Hubbert curve my first reaction was, “It does not incorporate price effects into the analysis and is thus flawed.” Looks like I was right in my hunch back then.
Alternative energy proponents have been saying that technology would drive down the cost and thus make it competitive with fossil fuel. But alternative energy by and large suffers from the problem of energy density. For example, driving one’s car usinig biofuel means creating a year’s worth of transportation out of a year’s worth of sunlight. With this natural physical barrier it is unlikely that technology breakthroughs alone could do much to wean us off of fossil fuel.
Currently conversion of coal or natural gas to liquid transportation fuel is deemed to be costly. However at its heart it means creating a year’s worth of transportation out of millions of years worth of sunlight. With that kind of energy density to work with and a steadily increasing cost for oil, the odds are good that technology can lower the cost of conversion over time.
The major issue as Prof. Hamilton raised recently seems to be government. Celanese claims it can make ethanol cheaply out of coal or natural gas. It is allowed to sell the ethanol as an industrial chemical but it cannot sell it as motor fuel, due to the law only allowing a year’s worth of driving to be made from a year’s worth of sunlight (corn or cellulosic ethanol). It is building a plant in China so we will see if its claims are true. If we changed the law to allow ethanol of any type to be used in E85 fuel then oil might see a real run for its money.
“But we should not dismiss the possibility that there may also have been a nontrivial contribution of simply having been quite lucky to have found an incredibly valuable raw material that for a century and a half or so was relatively easy to obtain”
I don’t understand the role of substitutes in this model. Even now, we are pretty close to the point where it is economic to convert trucks and large equipment to natural gas (CNG or LNG). Shell and a number of other companies are looking at “refining” shale gas into diesel (presumably heating oil and other products could be done as well) given the oil-gas spread per mmbtu. Shale gas in Europe has not been tapped (yet) to the degree it is here.
Higher prices not only incentivize production, but also substitutes, which accelerate the declining oil intensity of the economy.
Deffeyes was estimating total global cumulative conventional crude oil production at 2,000 Gb, and he put the conventional peak between 2004 and 2008, most likely in 2005. He thought that unconventional production would be help, but it would not be sufficient to keep total global crude oil production on an upward slope.
Note that global crude oil production has been virtually flat since 2005 (including 2011):
http://i1095.photobucket.com/albums/i475/westexas/Slide05.jpg
Slowly rising unconventional production has helped, but so far it has not been sufficient to keep total global crude oil production on an upward slope.
So, despite a doubling in global annual crude oil prices from 2005 to 2011, we have seen virtually no increase in global crude oil production.
And then there net exports situation, with developing countries, led by China, consuming an increasing share of a declining volume of Global Net Exports of oil.
A brief explanation of the difference between production and net exports:
A proposed new name for the P/C (Production/Consumption) metric: ECI, or Export Capacity Index.
For example, Saudi Arabia’s annual 2011 production (BP, total petroleum liquids) was the same as 2005 annual production rate, but their ECI, or Export Capacity Index–the ratio of their total petroleum liquids production to their domestic liquids consumption–fell from 5.55 in 2005 to 3.90 in 2011.
As a country’s ECI approaches 1.0, their net exports approach zero. At the 2005 to 2011 rate of decline in the Saudi ECI, Saudi Arabia would approach a 1.0 ECI, and thus zero net oil exports, around the year 2034, in about 22 years.
James, what is the definition of oil in the graph which shows actual and predicted values for the ratio of current to total cumulative oil production, in the IMF study?
Deffeyes definition is crude + condensate (including tar sands). I cannot seem to find one in the source paper.
Best…
My view is that the IMF researchers’ approach is clearly better than the simple Hubbert-Deffeyes linearization, but may still be subject to some of the other problems documented by Boyce (2012), as well as the familiar challenges of statistically distinguishing supply and demand effects.
It is obvious that we can change the production curve if we invest in capital destruction as is happening for tight oil and gas extraction in shale formations. It is also true that if we play around with our definition of what is crude and look at aggregates that allow NGLs, biofuels, or refinery gains to muddy the water we can make things look a bit differently. But what we cannot do is change the geological and thermodynamic reality. Using water drives to get out the oil from a conventional reservoir faster may help our curves today but only at a cost of hurting them tomorrow. It will also cost us in terms of energy investment that will be required to extract the oil and possibly negatively impact the ultimate extraction if we are not very careful.
I would say that, as usual, the official bodies like the IEA and IMF are too optimistic. Let us note that a decade ago we had CERA, the IEA, and the EIA claiming a depletion rate of around 3-4% while Deffeyes and others who relied on Hubbert’s methodology were suggesting a much higher number. Eventually the pessimists prevailed and the depletion rate was recognized to be above 6%. The ‘new’ production that is changing the curves comes from areas that have depletion rates of over 25% and are much more expensive to develop. None of this will matter to the Peak Oil argument because we still have peak production for light sweet oil staring us in the rear view mirror even as big cracks are showing up on the balance sheets and cash flow statements of the shale sector. If anything the false hope and hype have made things worse because we have seen the closure of nuclear and coal generation facilities across the globe. This is bad news for developed economies and signals a massive crash ahead.
If there were any faith in alternative energy at all, we’d be drilling like crazy to get our oil and gas to market while the price is still high.
Regarding projections from a decade ago, note the pricing mechanism worked! Clearly the IEA’s projections were done without considering geology. Those of us much more pessimistic missed the great changes resulting from a new higher price deck: Efficeincy gains, new technology (horizontal drilling) and substitution (natural gas).
Oil has become a zero sum game. The more oil the third world uses, the less oil the west uses. Whoever utilizes scarce capital most efficiently to produce goods that can be traded for oil, gets the oil. Capital misallocation caused by wanton printing (housing Minsky) just makes the west less competitive on the international oil market.
In Keynes day, western nations could simply order their empires to send them oil and other natural resources. Today, the west competes efficiently on the global market, or someone else gets the oil. Less oil, less real GDP.
I think it’s relatively clear that Deffeyes correctly identified a turning point in the supply quite accurately. Since late 2004, the crude supply has not really grown. What growth we see has been primarily shale oil. However, if one looks at Exxon’s OECD oil supply forecast to 2040 (I sat through a presentation yesterday), it shows as essentially flat. If there’s a shale oil revolution in the advanced economies, it’s not showing in the outlook yet.
Much of the required increase in production is slated to come from OPEC, where we are assured there is amply resource. For modest production growth, there should be. But global oil demand is not necessarily the driver of OPEC production.
The world consumes 31,755,000,000 barrels of oil per year (31.7 Billion Barrels)
The US consumes 7,117,500,000 barrels of oil per year (7.1 Billion Barrels [22% of World Consumption])
Gulf of Mexico Reserves
Discovered: 2006
Size: 7 – 15 Billion Barrels
Could keep world economy running for: 3 to 6 months.
Could keep US economy running for: 1 to 2 years.
Largest oil resource discovered since Prudhoe Bay.
Prudhoe Bay
Discovered: 1968
Size: 10 – 25 Billion Barrels
Actual Production To Date: 11 Billion Barrels
Remaining Reserves: 2 Billion Barrels
Alaska National Wildlife Reserve (ANWR)
Latest Estimates: 1998
Size: 5.7 – 16 Billion Barrels
Could keep world economy running for: 2 to 7 months.
Could keep US economy running for: 1 to 2 years.
North Dakota Tight Oil (Bakken)
The average tight oil well produces 1000 barrels of oil per day the 1st year.
The average tight oil well produces only 250 barrels of oil per day the 2nd year.
The average tight oil well will only produce 550,000 barrels of oil in its lifetime.
Compare that to The Deepwater Horizon which was set to produce 55,000 barrels of oil per day if it hadn’t exploded.
“Unconventional” oil and gas (deep water, secondary recovery, shale, tar sands, etc.) not only cost more dollars to produce, they cost much more energy, thus more rapidly depleting the total resource. Manufacturing hydrocarbons with coal would similarly doubly deplete another very finite resource. The math is inescapable: the resources are finite, no matter what rising prices allow us to process beyond conventional oil. Yes, we can stretch out the oil decline (but not raise the peak?) beyond that of the conventional oil and fixed prices with which Hubbert and Deffeyes worked, but they (and Malthius!) were certainly correct in principle. The era of carbon and hydrocarbon fuels, including natural gas, will be only a brief moment in the history of Homo sapiens.
John Theodorou: I understood Figure 1 to refer to the EIA total oil supply, which includes lease condensate, natural gas plant liquids, biofuels, and refinery processing gain.
An ambitious IMF paper, that is to include four variables and to assess oil future price and oil world production.
As an example of a multi variables dimension “The Great Recession, from 2009, was so severe that oil prices dropped below the original 2002 forecast”. At that time 1.5 trillion euros left the European zone,the sudden shortage of funds in one location, may have had an impact on the oil price convexity.
Many Econbrowser posts,comments and among very few “Commodity index funds and oil prices”, “Peak production for U.S. oil-producing regions”, may raise doubts as to prices ingenuity based on the sole combination of supply of oil, demand for oil, technology, improvement and estimated reserves.
When looking at the PA oil peak,we may look at the Econbrowser “charts on historical oil production peaks for US producing regions” in conjunction with business booms and depression since 1775 (Fraser, Fed Saint Louis).
http://fraser.stlouisfed.org/docs publications/1943chart_busibooms.pdf
The dollar was purchasing the same quantity of energy whether or not peak oil production were explicit or implicit market events. How would the IMF model fit,when backdated to the period covered “business and booms since 1775”
@ JDH at June 14, 2012 08:46 AM;
Thanks for that information. It’s apparent then that the IMF report is mixing its spirits, so to speak, as “oils ain’t oils” as an old Caltex TV ad from downunder used to say. 🙂
Best…
John Theodorou: The EIA reported their forecasts in terms of total oil supply, whereas Campbell reported his for a more limited construct. Because those figures are just summarizing the published forecasts of others, in each case the IMF team used the respective units favored by the original forecaster.
I wonder if these studies include a price-ceiling for oil demand arising from the possibility of manufacturing oil from coal. In equilibrium, oil extraction from teh ground should halt completely when the price rises to that level.
Another way to forecast oil supplies would be to use the Hotelling model. If oil is running out, then its rent should rise at the rate of interest until the quantity demanded is choked off. A problem with viewing oil as nonrenewable is that the rent hasn’t been rising at the rate of interest, though. Do these studies take note of that?
Eric Rasmusen Another way to forecast oil supplies would be to use the Hotelling model.
A few months ago I posed pretty much the same question to JDH. He provided a link to one of his papers on oil in the macroeconomy. I think the kwikee summary is that oil did not follow a Hotelling model in the past and in fact followed a random walk; but the reality of oil as an exhaustible resource might be just starting to dawn on folks. Some of the volatility in oil prices might be interpreted as the market trying to find a Hotelling price and extraction rate. The apparent fact that the Saudis can no longer open the spigot as wide as they wish suggests that they are having to think seriously about exhausting supplies.
Great post. The cornucopians quibble but on balance Hubbert and his disciples are being proven conceptually correct. When we take into account the number of moving parts and assumptions involved, the forecasts based Peak Oil Theory are extraordinarily accurate- certainly more accurate than contemporaneous “Peak Oil naive” forecasts.
The greatest problem in envisioning the future path is the inherent instability in modern human economic systems. This has been revealed and exacerbated by the encroaching reality of Peak Oil. Does anyone doubt that had the early 2000 decade EIA forecasts of oil production been correct that most of the global problems related to excessive debt and low growth would have been either non-existent or far milder? Kenneth Deffeyes was early and accurate in drawing attention to the destabilization of commodity markets that reach supply limits. The destabilization of the oil market has serious knock-on effects on the global economy (separate and in addition to simply higher prices for oil). If there is one area that needs further investigation and understanding, this is it. The feedback loops have feedback loops and I am increasingly concerned that an inability to cooperate at all levels could move forward the collapse scenario presented in LTG. What we have is a very complex system and there is a real question as to whether it has outrun our ability to manage it.
Excellent post. Excellent comments.
This debate is far too focussed on just a couple of decades, so it is akin to bishops arguing over how many angels could fit on the head of a pin. I am 70 and have seen 10-fold increases in oil consumption in my lifetime. But what will my grandson expect to live on when he is 70, with a doubling of world population and a finite pool of oil to share? No matter what fiddle-factors economists debate over, we are all going to have a lot less oil in the decades to come and how we deal with that should really be the focus of this debate.