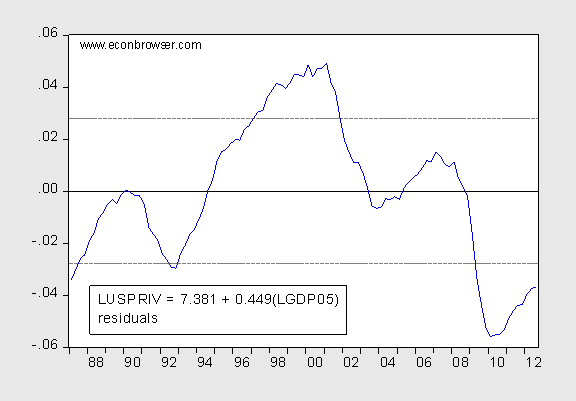
The latest GDP release gives me the opportunity to re-evaluate whether job creation is less than what would be expected, given the growth in real GDP. At first glance, it seems obvious that growth in employment is less than expected. A simple OLS regression of log private employment on log real GDP over the 1987Q1-2012Q3, which might be implied by a particular form of Okun’s Law.

Figure 1: Residuals from an OLS regression of log private nonfarm payroll employment (quarterly average of monthly data) and real GDP in Ch.2005$. Dashed line: Two standard error band. Source: BLS (Sept. employment release), BEA (2012Q3 advance release), and author’s calculations.
Notice that using this simple (log) linear specification, private employment appears some 4% less that predicted (and statistically significantly different from predicted). However, while the adjusted R-squared is quite high for this regression (about 0.91), the DW statistic is around 0.06, suggesting spurious regression. This casts in doubt the proposition of a substantial underprediction.
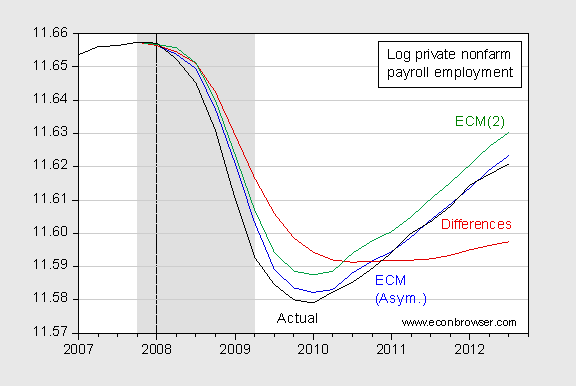
In order to deal with this problem, one can either estimate in first differences, or incorporate the long run relationship using a specification allowing for a cointegrating relationship. Following the methodology outlined in this post from April, I estimate a first differences and error correction specification up through the beginning of the recession (1987Q1-2007Q4), with dynamic forecasts starting from 2008Q1. The results are shown in Figure 2.

Figure 2: Log actual private nonfarm payroll employment, quarterly average of monthly data (black), out-of-sample dynamic forecast (historical simulation using ex post values) using first differences specification with four lags (red), error correction model with two lags of first differences, GDP exogenous (green), and error correction model with recession dummy (blue). NBER defined recession dates shaded gray. Vertical dashed line at 2008Q1. Source: BLS (Sept. employment release), BEA (2012Q3 advance release), and author’s calculations.
The first differences specification clearly goes off track. However, it was surprising that the error correction specification fails to capture the level of employment. Allowing for an asymmetry associated with the GDP contractions largely eliminates the gap (0.2% rather than 0.9%, in log terms).
[Note that I am using the out-of-sample dynamic forecasts as a diagnostic. The actual values of the level of GDP are used to forecast employment, rather than full dynamic forecast where both GDP and employment are recursively forecasted, and used to further forecast out. (technically, these are “historical simulations”). Full dynamic forecasts of the ECM would undoubtedly do worse.]
The long run elasticity of employment with respect to GDP is 0.46, lower than the 0.49 implied by the standard ECM; perhaps more important for interpreting the quarter-to-quarter changes, is the coefficient on current employment change with respect to current GDP change: 0.14, versus 0.18 (although not statistically significantly different).
Bottom line: Private employment growth does not appear out of line with the historical relationship obtaining over the 20 years leading up to the recession that began in 2007Q4, as long as a dummy (level and first difference) for contraction in GDP is included.
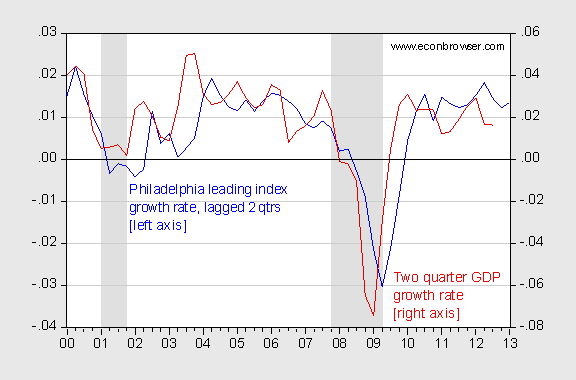
Looking forward, what are the prospects for GDP growth? Figure 3 shows the correlation between the Philadelphia Fed leading indicator for the US, lagged six months, and the subsequent 2 quarter GDP growth.

Figure 3: Philadelphia Fed leading index for US, lagged two quarters (blue, left axis), and annualized two quarter growth rate in real GDP (red, right axis). NBER defined recession dates shaded gray. Source: Philadelphia Fed, BEA (2012Q3 advance), and NBER.
The Philadelphia Fed leading index predicts the coincident index growth over the next six months, rather than that of GDP. However, the correlation above is striking. The leading index suggests continued, albeit lackluster, GDP growth. The most recent employment indicators are consistent with this view. [1] Of course, the advent of Sandy has no doubt made the outlook more uncertain, as Jim’s post indicates.
http://research.stlouisfed.org/fredgraph.png?g=ckW
http://research.stlouisfed.org/fredgraph.png?g=ckV
http://research.stlouisfed.org/fredgraph.png?g=ckX
Take a look at the latest real final sales less reported labor productivity. Employment might have peaked (and the U rate bottomed) for the cycle in Q2-Q3.
http://www.gallup.com/poll/158060/unadjusted-unemployment-mid-october.aspx
Yet, Gallup’s self-reported unadjusted U rate is at 7.1%. The best data do tend to occur at cyclical peaks, of course.
However, US Treasury withholding receipts m-m for Sept.-Oct. at the reported wage and salary levels and rates imply a decline in civilian employment by more than 250,000 for Oct., albeit a 1.7% yoy increase.
http://research.stlouisfed.org/fredgraph.png?g=ckY
http://research.stlouisfed.org/fredgraph.png?g=ckZ
Despite the recent bounce, real personal income less transfers remains below the historical expansion level.
Finally, the average trend rate of real GDP since ’00-’01 has decelerated from the long-term rate of 3.3% to 1.6%, with trend real GDP per capita having decelerated from 2.1% to well below 1% to date. Real GDP per capita since ’08 is ~0%. This is the similar pattern experienced by Japan from ’90 to the early ’00s.
Since ’00, the US has cumulatively lost 15-20% from the long-term trend growth rate of real GDP.
Since ’90, Japan has cumulatively lost 40-45% from the long-term trend growth rate of real GDP.
Were the US to repeat Japan’s pattern over the course of the rest of the decade, which the peak Boomer demographic drag effects imply will occur, US real GDP will trend around 0% to no faster than population growth hereafter, resulting in a post-’00 trend annualized rate of real GDP of 1% or less for 20 years.
Gov’t incremental spending growth will virtually cease under the above conditions, even with large fiscal deficits persisting, reducing the nominal GDP trend from 3.6% since ’00 and 2% since ’08 to a post-’00 20-year trend of 2% or less, and less than 1% hereafter.
Is the unemployment number for September realistic?
USA Today
Growth is likely being under estimated at this point. The 1st quarter a good example.
Looks like the 2nd straight year of strong bookends to a softer middle.
I wonder what relationship if any exists between these trends and the growth in aggregagte labor productivity, which was quite strong 2009-2010 but has been relatively weak lately.
Heck Ricardo, why not use 1953 as the goal instead of 1998. That year the average unemployment rate was 2.9%
More seriously, some historical data: average unemployment by the decade.
1950’s: 4.51%
1960’s: 4.78%
1970’s: 6.21%
1980’s: 7.27%
1990’s: 5.75%
2000’s: 5.55%
For the entire era from 1948-2011: 5.76%
The all time best period? From 1952 to 1957, average unemployment was 4.03%
To segue a bit, but on economic history, here is GDP returns by Presidency:
Kennedy/Johnson 5.2%
Clinton 3.7%
Carter 3.4%
Reagan 3.3%
Nixon/Ford 2.7%
Eisenhower 2.3%
GHW Bush 1.9%
Truman 1.8%
GW Bush 1.7%
I think those numbers may surprise a lot of folk…