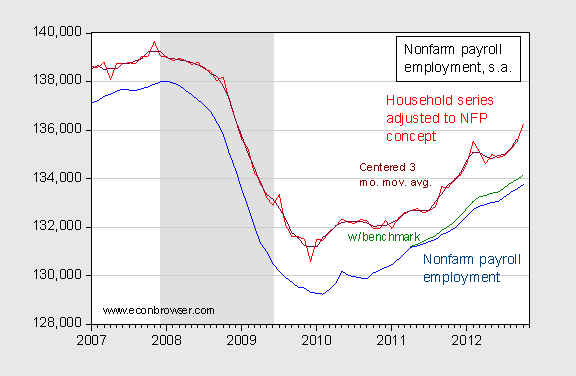
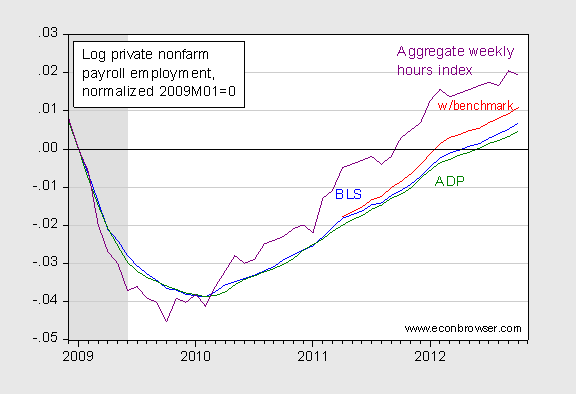
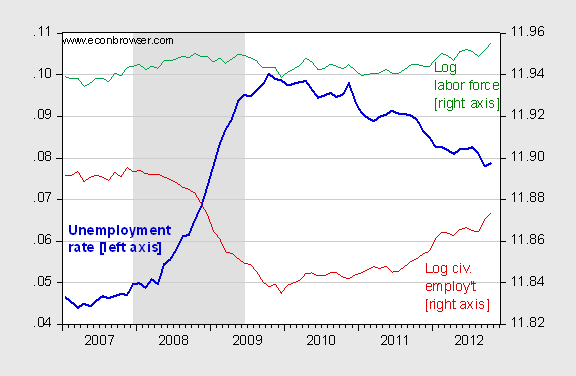
Figures 1 and 2 illustrate the improvement in nonfarm payroll and private nonfarm payroll employment, respectively. Figure 3 highlights the fact that total civilian employment and labor force both increased in October. Interestingly, civilian employment growth in October continues that reported for September, the veracity of which some observers had questioned.

Figure 1: Nonfarm payroll employment, October release (blue), October release, adjusted by March 2012 preliminary benchmark release (green), civilian employment adjusted to NFP concept (red), and three month centered moving average (dark red), all seasonally adjusted. NBER defined recession dates shaded gray. Source: BLS via FRED, BLS, NBER and author’s calculations.

Figure 2: Log private nonfarm payroll employment, October release (blue), October release adjusted by March 2012 benchmark revision(red), October ADP release (green), and aggregate weekly hours in the private nonfarm sector (purple), all seasonally adjusted, normalized to 2009M01=0. NBER defined recession dates shaded gray. Source: BLS via FRED, NBER and author’s calculations.

Figure 3: Unemployment rate (bold blue), log civilian employment (red), log civilian labor force (green), all seasonally adjusted. NBER defined recession dates shaded gray. Source: BLS via FRED, NBER and author’s calculations.
Note that (1) hours have increased more than employment in the private nonfarm sector; (2) unemployment has decreased, and is has decreased over the last three months as employment has risen more rapidly than the labor force; (3) the employment growth in October succeeds the growth in September which some observers had cited as implausible (a claim critically assessed here).
The employment situation report is here.
The employment to population ratio rose from 58.7% to 58.8%, while the labor force participation rate rose from 63.6% to 63.8%. So the household survey is telling us good news too. But then these numbers indicate that the unemployment rate inched up from 7.8% to 7.9%, which of course, Team Romney is emphasizing in their spin where this was bad news:
http://econospeak.blogspot.com/2012/11/romneys-take-on-employment-report.html
Using the results for October just when do you project we will see 4.5% unemployment?
What about the weakness in hours worked, average hourly earnings and weekly wages?
Do you think we should ignore that part of the report?
http://www.zerohedge.com/news/2012-11-02/chart-day-americas-geriatric-work-force
spencer: No, those are interesting statistics; aggregate hours worked is included in Figure 2. I note that earnings/hour is down only a cent from September (for all private workers).
Another cut — FRED doesn’t seem to have everything — I’ve a table and graph of changes in age-specific employment/population ratios on my (undergrad) macro seminar web site. It misses changes in hours but avoids the impact of shifts from unemployment to/from the labor force, and the impact of aging baby boomers. With one exception (age 50-54) all brackets improved over the past year. Modest, but moving in the right direction.
One surprise is that there is no suggestion of recession-induced early retirements. Another surprise (though I see the same thing in Japanese data) is that employment rates have risen monotonically for the oldest brackets (65-69, 70-74 and 75+), esp since 2002. Retirement may not be a thing of the past, but baby boomers and above are hurrying to make way for younger workers (lock-box issues aside).