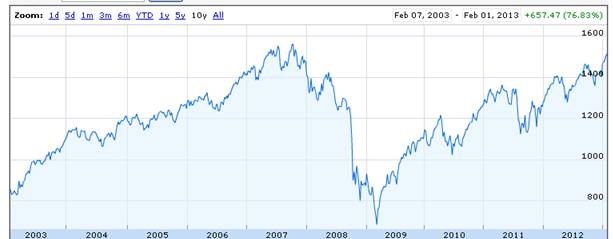
With the stock market setting new 5-year highs, I was interested to take another look at some of the long-term fundamentals underlying equity values.
On the one hand, I’m expecting the real economy to be doing better in the second half of the year than it is right now, and inflation and interest rates to remain low through the end of the year. All of that should be bullish for stocks.
 |
But the question is, how much of that good news is already priced in? Below is an update of one of the graphs from Yale Professor Robert Shiller’s very long-term data set to which I’ve often referred. The green line is a price-earnings ratio on the S&P500 or earlier counterparts. So as not to overstate the impact of temporary spikes up or down in earnings, Shiller relates the current inflation-adjusted stock price to the previous ten-year-average of inflation-adjusted earnings. That backward-looking P/E currently stands at 22.8, well above its average value of 16.5 in data going back to 1880.
 |
If the ratio of prices to historical dividends is unusually high right now, and if you expect the ratio to revert to more typical values, it suggests that you should expect a lower capital gain on stocks you buy today compared to what you would have earned if you bought at a time when the P/E was at or below its historical average. The blue line in the graph below shows the annual rate of return you would have earned by buying stocks at any indicated date and holding on to them for the next decade. That line stops in January 2003, because we don’t yet know what the 10-year return of a stock purchased in February 2003 will turn out to be, and we certainly don’t know what the 10-year return on a stock purchased in February 2013 is going to be. But what we do know is that in the historical record, you did indeed tend to earn a lower return on stocks if you bought them at a time like today when the P/E is relatively high.
 |
But what else are you going to do? Low as the dividend yield is on stocks at the moment (2.04%) , it’s still better than what you can get on a 10-year U.S. Treasury bond. Moreover, any inflation in the prices of the goods and services that firms sell, as well as any profit gains associated with a larger market, should boost those dividends over time, whereas inflation would continue to erode what you make on the Treasury. Or you might look at a Treasury Inflation Protected Security, whose coupon will rise with the headline CPI. That’s currently yielding a hefty -0.57%. Anybody want to sign up for that 10-year plan?
 |
Or you might consider a real estate investment. Of course you would have made a huge loss on most real estate purchased in 2006.
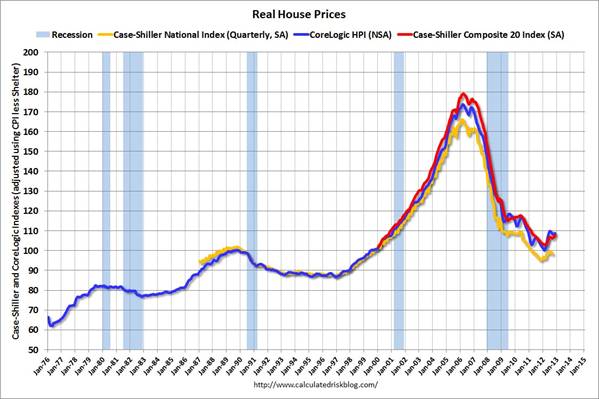 |
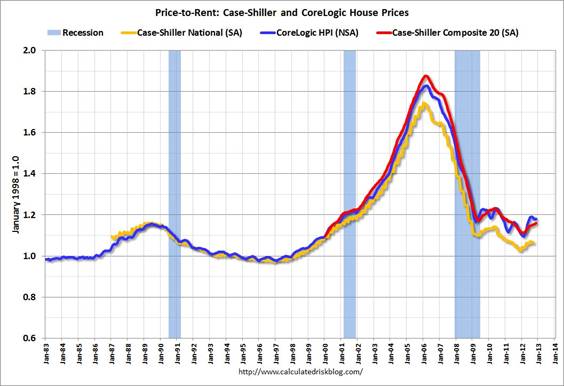
But that’s exactly the attraction of the investment right now. Just as the run-up in stocks makes them a less attractive investment today, in terms the value you’re getting for your investment dollar, the collapse in house prices makes them a more attractive investment today. It’s true that, adjusted for inflation, house prices are still above where they stood in 1980. But with growth in real incomes since then, that might be expected. One can think of the price/rent ratio for houses as similar to a price/dividend ratio for stocks. You can buy property and earn a future income stream from the rental income, or you can buy a stock and earn a future income stream from the dividend income. And the price/rent ratio at the moment is not that out of line with its pre-bubble historical average.
 |
The question is maybe not what is a good investment right now, but instead what is the least bad investment.
In value terms, the choice really is which investment is the least bad. The markets are being manipulated by the Fed and the Federal Government, so it’s a matter of deciding which will be manipulated most favorably to the investor. At the moment, I think stocks are the winners, but that could change quickly.
Housing is a terrible investment, given the demographic tsunami of Baby Boomers retiring.
Stocks will do better, since US stocks reflect global GDP growth (over 50% of the earnings of S&P500 companies are from overseas).
So at least US stocks benefit from China’s growth. US housing does not.
I don’t know how Obama and Bernanke could make it any clearer: trillion-dollar deficits as far as the eye can see, monetized all the way.
I’ll take stocks and commodities, maybe some real estate too. Anybody buying bonds ought to have his head examined. Even bond guys like Bill Gross are saying as much.
Profit rates have increased to historic highs, but they have reached the limit. They won’t increase much. There are still good profits, but if the profit rates don’t increase, then profit rates are already factored into stock prices, maybe even too much.
Also, if profit rates increase, that means that labor share of income will decrease, which would mean that the economy would hit the wall faster and trigger a contraction. But business is business and they will try to push the profit rates too high at the expense of labor. This is not good short-term or long-term.
As for markets, there has never been such an axiomatic definition of supply and demand driven prices. Let us recapitulate:
Expansion, Recession, Depression is prone to defy Kondratiev cycles
Central banks liquidities are plentiful and will assist in defeating any purge of excess.
Smoothed U.S. Recession Probabilities, recessions are optically of short duration.
http://research.stlouisfed.org/fred2/series/RECPROUSM156N
Central Banks balance sheets are no longer constrained by any measures or benchmarks or fiduciaries obligations and may be extended at will and purpose as testified by the BOE representative (source Bloomberg)
“Carney Says Central Banks Not `Maxed Out’ on Policy”
Central banks balance sheets are of 18 trillions even though these balance sheets may include assets and contra accounts offset but kept till maturities.
Real estates prices are no longer a private markets dealings but a public driven matter for whatever purposes. Those public aims are irrespective of incomes and revenues existing or future.
Sovereign bonds yields are not coming close to a risk assessment pricing.
At these levels of public debts ~50 Pct of the public debts were in default in
1830 1880 1940 1990 (This time is different graph 1)
Banks income and profit statements are more dubious than ever, they extend the time of creative accounting.
For all reasons ,a yield of 2 Pct is feasible (economics term) doeable (financial term) in the stocks markets.
Unless Fourier series come into play in the universe of the matrices of variables.
From eye-balling the third chart I would make a rough guess that whenever the Shiller PE has been around current levels in the past, the forward 10 year annual return on stocks has averaged around 3-5%. Which might be still be the best from a lot of bad choices.
Readers would find it very useful if Econbrowser were to do us a simple regression of the forward return on the PE ratio.
Of course, Bill Gross’s predictions haven’t panned out very well for the last half decade — But maybe the political hammer of fear of “inevitable” inflation generated by the Fed’s actions is more important than real investment results?
You cannot ignore the impact that policy makers have on securities prices. The market rises and falls quite dramatically on fiscal cliff negotiations, euro debt talks, and of course, FED QE. The markets seem to respond less to fundamental news these days, though fundamentals certainly provide a link to reality.
QE still acts as a Put option. The market knows that if things get bad, the FED will pump liquidity into the financial system. I believe we will get much more volatility when the expectation begins to creep in that QE is ending.
Maybe if Baraqeh Al-Husseini Obumbler hadn’t implemented socialism and killed the free market, we would have seen some stock market growth during his tyrannical reign!
Oh wait…
Here’s what I think about:
Will there be top line growth at US companies? We have cut about as much “expense” out of the system as we can – hence “record” profits. Now we need increased sales.
The real estate underinvestment of the past 6 years is greater than the real estate overinvestment of the bubble years. New normal or will this turn around? If it turns around it will be huge.
There’s a massive backlog in new household formation.
The coming “regularizing” of how many undocumented immigrants?
Given these factors I am planning on further upside and I continue to be a buyer of high quality US equities (and Canadian government bonds!)
Relevant anecdote: Co-worker sold everything when Obama was elected – he figured the re-election of the Kenyan Muslim Socialist would cause a world economic crisis. He asked me January 2 if he should get back in. I said yes. He didn’t. Maybe he will have the last laugh…but in the meantime I made a crapton of money in January.
Close, but I would ask you to chart your S&P values as a log scale rather than absolute values. The pattern becomes pretty apparent then. What you are seeing is the pattern of labor capital transformation in the larger economy.
Also, paying attention to pre-1980 stock pricing is not informative. The Fed in those days targeted stable interest rates, so the interest rate regime was completely different until the Volcker Revolution of floating interest rates. (OK, he went a little nuts and pushed us into the 1980-1982 Event because of his complete and total underestimation of falling velocity in recession environments) — the 1980s were not the Reagan Revolution they were the Volcker Revolution Years.
#1 Pay off your student loans that boomers have saddled you with. At 7%, there is no better “risk free” return around.
#2 Gold has increased at 8% CAGR since 1971. With the printing presses at full speed, this is only likely to continue.
My wife and I have decided to put extra money into paying off our mortgage faster. Even at today’s low rates the interest savings over the life of the loan are substantial. It seems to be the best “safe” return we can get right now. If we can pay it off early, we can retire with no mortgage.
“So as not to overstate the impact of temporary spikes up or down in earnings, Shiller relates the current inflation-adjusted stock price to the previous ten-year-average of inflation-adjusted earnings.”
If you do that then of course stocks were a buy in 2009. But at the time earnings had sunk so much the P/E on a trailing 12 months basis was actually in the triple digits! One could say the earnings slump was temporary but how do you know how much is temporary? Obviously the situation then was different than from much of the previous decade… there was a recession! You can’t just ignore the reality of that recession not least because it could last for years like in the 1930s.
The bottom line is that you would not invest in a single company based just on the average of its earnings over the last decade. One company could be growing its earnings over the whole period while another could have declining earnings but they have the same average. It should be obvious that the growing firm is a better investment but that means using more current data.
Anonymous:
#1 – huh? Pay for college yourself or don’t go. Or maybe I would be mad at my parents for not saving anything – not boomers lol.
#2 – 1971. Of course! Gold’s artificial price point of $35 per oz. While technically correct, your comment only works if you smooth the returns thru the CAGR calculation. Personally I would take the 7% CAGR of the S&P 500 and collect the dividends for 41 years along the way…
Stocks almost always look good compared to bonds and cash, precisely because they are the most risky of these 3 asset classes. What else is new? The real question is whether someone with a lump of cash and a 20+ year investing horizon should put that lump of cash into stocks now, or keep it in short-term bonds while waiting for a better buying opportunity. Right now, all possible good news is priced into stocks, so there is limited upside and tremendous downside potential. If nothing goes wrong, you squeeze out maybe 3% more in stocks per year than in short-term bonds. More likely, there will be an opportunity to buy at a 20% or greater discount from current prices. That 20% discount represents 6 years of difference in return between stocks and short-term bonds, so if the disaster and thus 20% off buying opportunity occurs sooner than 6 years from now, you’d be advised to wait to buy.
Now is a BAD time to buy stocks.
Um… what about holding CASH until this current Fed-induced Stock bubble bursts and then buy in when we re-test the 2009 lows? Doing anything else seems unwise and desperate.
http://www.hussmanfunds.com/wmc/wmc130204.htm
http://www.ritholtz.com/blog/2013/02/market-capitalization-as-a-percentage-of-gdp-4/
http://advisorperspectives.com/dshort/updates/Secular-Bull-and-Bear-Markets.php
http://advisorperspectives.com/dshort/updates/PE-Ratios-and-Market-Valuation.php
http://advisorperspectives.com/dshort/updates/Crestmont-PE-Ratio.php
https://www.frbsf.org/publications/economics/letter/2011/el2011-26.html
At a 10-yr. average P/E at 16 or higher and real reported earnings contracting yoy, the largest stock market crashes in history have occurred since the 1880s.
Moreover, there are numerous textbook technical indicators strongly suggesting a cyclical top from last Sept. to date, including Coppock Curve Killer Waves (as in ’00 and ’07), Tom DeMark (TD) sell signals perfecting at various time scales for world major indicies, and a weekly MACD non-confirmation at the Sept.-Oct. and recent high, which similarly occurred at major cyclical stock market tops in the past.
We also have EXTREME bullish sentiment characteristic of cyclical tops and record profits to GDP at 75-80% above the historical avg. and 130% above the avg. at cyclical recessionary and bear market troughs.
Secular bear markets are periods of valuation compression, debt deflation, and consumption of accumulated assets over the course of the preceding secular bull market.
The avg. dividend yield during secular bear markets was 5.1%. Today’s dividend is barely 2%.
The avg., trough-to-trough, and peak-to-peak real total return an investor receives from the S&P 500 over the course of successive secular bull and bear markets, i.e., a working, saving, and investing lifetime, is the avg. dividend (before taxes, fees, etc.); no more, no less. Wall St. and the financial services industry won’t tell you this, because they can’t tell you for fear that they lose AUM from which they scalp fees and provide no value add (except to themselves) over the course of a secular bear market.
Finally, secular bear markets since the 19th century, including the UK and Japan, have had 4-5 cyclical bear markets, whereas we have had only 2 so far. Thus, we are due 2 or more cyclical bear markets to take the P/E to the 8-10 area
One more point. AAPL is negative yoy for the first time since the onset of the last two bear markets in Sept. ’00 and Sept. ’08. AAPL is THE leading stock for the most recent “echo-echo bubble” for stocks. The self-similar super-exponential blow-off trajectory AAPL exhibited with the NDX implies an “anti-bubble” target for AAPL at or below $100 in the next 12-18 months.
GOOG perfected a weekly and monthly TD Sell Countdown sell signal at the Jan. close AND an infamous Coppock Curve “Killer Wave” similar to AAPL in Sept. ’12.
At a minimum, one should be reducing equity allocation and/or hedging long positions hereafter to retain avg. gains since ’09 and enhance and protect gains and purchasing power after ’14-’15.
Wall St. and economists won’t tell you when to sell. Return “of” one’s money is the imperative at cyclical highs during secular bear markets, not a return “on” one’s money.
For many people the best investment they can make is paying down debt or defaulting. Anyone with credit card debt should “invest” there first.
There are many folks who will not default on their home loan even if they are a bit underwater, yet they cannot refinance and may be stuck at rates of 6%. Many of these folks don’t itemize their taxes, so they pay that 6% after-tax. So paying down that mortgage as fast as possible yields a very healthy 6% guaranteed after-tax return.
Basically, deleveraging is the best investment for millions of Americans.
@Brucie
AAPL is down yoy because of lack of innovation with new products. They’ve been making the same phone since 2007 and the cool factor is starting to die. People are catching on.
randomworker, do you realize that your bullishness is occurring with bullish EXTREMES in virtually all sentiment indicators that occurred in ’07 and ’00?
Do you realize that US non-financial corporate debt to GDP is at a record high going back to 1929 and Japan in ’89-’95? Despite the hype about corporate cash levels, debt levels have been rising at a faster rate than cash.
Corporate debt to GDP reached a differential order of exponential magnitude going all the way back to the 1950s; that is, the 65-year inflationary and reflationary debt era is over.
Corporate cash flow to debt growth is at a cyclical and secular peak, implying that increasing debt to buy back stocks and to pad cash levels will no longer increase profits and cash flow hereafter. Another cyclical round of cost cutting, job cuts, and capacity reduction is due.
Tew, excellent point about net returns to deleveraging. This will also apply to businesses in the years ahead as related above. Debt/asset deflation will occur coincident with slowing cash flow, profits, and top line revenue growth, and further deceleration in depreciation and investment.
Chance and revelo, you have it.
Brian Dell, remember, putting savings at risk in the equity market is “speculating”, not “investing”. Wall St. and the financial services industry wants you to perceive yourself as the latter while they make money “speculating” with other people’s money, including yours.
Wall St. and the hedge, mutual, and, by extension, pension fund industry is a parasitic cesspool of dishonest, self-deluded, overconfident fee scalpers who have no better way to make a living than financially bleeding people to death.
Jones, quite. BTW, that’s BrucEE (TM) to you. 😉
AAPL’s market cap was growing at a rate that by last summer would result in the company becoming larger than US GDP by the ’30s (like CSCO in the late ’90s and GE later). The second-order super-exponential rate of acceleration of the stock price was a textbook example of a price blow-off that reverses and crashes back to the level at which the super-exponential acceleration commenced.
http://www.avadream.com/blog/mothership/
Also, the hubris and untimely death of Jobs and the company’s decision to build the so-called “Mothership” HQ (now “delayed”) were signs of peak confidence/overconfidence, i.e., the “Skyscraper Theory” of secular tops and the believe that apple trees can grow to the sky.
After all, AAPL products are effectively overpriced toys for teens and adults that assist us in wasting lots of time, including what FB offers, which is hardly more than a intolerable virtual ad-pushing service that all the young narcissistic hipster “adappsters” (TM) think is indispensable to human existence.
Stocks and bonds are both bad investments right now. Maybe people would be better off going back to the family jewels for retirement savings. It worked for our ancestors.
Ekim, wisdom.
http://www.youtube.com/watch?v=-iswT3PfMec&feature=player_embedded#!
The Anglo-American empire is quite literally a truly global militarist criminal financial syndicate, the likes of which the world has never known at the current global scale. With the possible exception of the plundering Mongols, the Babylonians, Assyrians, Persians, Greeks, Romans, Ottomans, Dutch, Portuguese, Spanish, and British imperialists were amateurs compared to the bankster-led, nuke-armed, parasitic plunderers headquartered in DC, Wall St., and the private chartered imperial corporation known as The City of London.
Where are the courageous, intellectually honest economists who know their benefactors are sociopathic, corrupt criminals? Where are the imperial ministerial intellectuals who will expose the fraud and plunder of the Power Elite and their sycophantic surrogates?
http://en.wikipedia.org/wiki/Scott_Nearing
http://en.wikipedia.org/wiki/Henry_George
Afraid to lose tenure, the McMansion, childrens’ private school tuition, department endowment, BMW, Mercedes, Range Rover, speaking fees, or vintage car collection, club membership of $10,000 and $1,000/year, wife’s cosmetic surgery fees, and state or private pension payouts? Yeah, we thought so. We empathize. Few of us are forged from such perishable materials.
Unemployment is at 7.9% and inflation is very low—there is incredible slack in the economy. Interest rates are historically low, but default spreads remain historically wide. There is barely any IPO activity, a sign of muted demand for stocks. In short, there is a great deal of room to grow and very little speculative activity in equities. March 6, 2009 was a great time to buy stocks. This is a good time to buy stocks.
@Bruce Carman
“After all, AAPL products are effectively overpriced toys for teens and adults that assist us in wasting lots of time, including what FB offers, which is hardly more than a intolerable virtual ad-pushing service that all the young narcissistic hipster “adappsters” (TM) think is indispensable to human existence.”
Wow, if I told this to my 23-25 year old peers, they’d be very upset with me.
I wish I had the capital to short 100 shares of AAPL.
@Jake, 11:31 pm: agreed. IPO activity is a sign.
But won’t go short AAPL, say Foxconn. The chinese are learning quickly and will be better soon, the koreans are already. RIM is out, even branded Blackberry. Speedy product cycles, short lived business plans, trendy gadgets, nothing solid.
Invest into infrastructure instead e.g.: ERIC. Long time service contracts, solid business plans.
randomworker
#1 Please describe in detail how an 18 year old can cut a check for $20K a year to attend college. Please explain how the lower 70% of the population could have possibly saved enough to send their kids to college on their dime. Higher education is a racket and a bubble, but Boomer’s have profited from it as overpaid teachers with exception benefits. The demand for education is through the roof when anyone can get loans to study anything.
#2 Artificial price point? Gold has a base value, to which we tied the dollar to. Paper bills do not have a base value. The dollar was artifically set to the value of gold, not the other way around. Looking back, the investment strategies seem ok between gold and the SP, but looking forward, gold is a much better bet as we continue to devalue the dollar, plunge deeper into debt and destroy the American economy, which ultimatly gives the dollar its value.
Jake: “There is barely any IPO activity, a sign of muted demand for stocks.”
There is little IPO activity because debt financing is cheaper than equity financing. Companies (and venture capitalists) have little incentive to sell equity when borrowing is so cheap.
Some of the hedge funds are investing in “depressed” retail stocks: dollar stores, pawn shops, wal-mart, target, auto-zone etc. They’ve done pretty well since ’08
I always regret following links here, but this:
> But what else are you going to do?
…is so…well:
There are a lot of bags that need holding,
so by all means, grab one. Hurry! Buy now, or be
priced out of bag holding forever! Jump from
one manipulated piece of paper, to another, because the executive suite would never pull a fast one on you…you are a special person deserving of income from your thoughtful reinvestment into opaque assets. Sure.
I guess if it helps you sleep at night, at
least that has value, for a while.
For your poor readers, however: perhaps you
should get busy adjusting your formerly first world lifestyle to fit the one your personal leverage has been deferring for too long.
If you managed to be smart about the stupidity around you, and thus still have plenty of capital to deploy despite attempts to herd you, there are plenty of more productive things you could be doing to prepare for the new normal, a globalized
average lifestyle…have a cup of Exceptionalism Tea, to help wash it down.
Anonymous, OK, I’ll bite.
#1. He might want to attend college but he doesn’t have to. It’s not required. In your initial comment you mentioned that the best investment was paying off 7% student loans. I would agree. But you blame “boomers” for the debt. No. You could have the taxpayers pick up the tab by joining the army. You could get a golf scholarship. My employer pays 90% not including books. I finally graduated a number of years after my peers this way.
#2. Mind if I take a pass on this gold-standard stuff? I think you have it reversed but there are many here much more knowledgable than I in this regard.
James,
Please could you comment on Dr Tim Morgan’s (of Tullett Prebon) “Perfect Storm”.
http://tullettprebonresearch.com/2013/01/21/perfect-storm-report-now-live/
I know in these pages you have consistently dismissed concerns about inflation and “nonsense’ of “shadow stats” type indices but in all fairness, Dr Tim Morgan has written what on the surface appears to be quite a compelling case for inflation.
I am surprised by how little area there is under the zero line in the equity chart. The footnotes do not say if the blue line is total return. Particularly since it represents “real” return, this is better than I would have thought. But we do not get “real return”. We get nominal return, which is then converted by calculation to real return in a variety of questionable ways. The question of what constitutes “real” return is subject to interpretation. Nominal return is presumably higher. Taxes of course lower the results as our policies are deFacto asymmetrical, favoring the Government of course.
Of course, we do not live in a world where we know the future, so it always feel scarier investing “today”. Also, the stock market is only what is publicly traded.
I believe the total return of all investments (ignoring taxes like M&M) cannot exceed GDP growth on average in the long run, counting companies businesses in other countries (and their proportional share of GDP).
It is hard to invest in real estate as the securitization market has died and banks are very conservative on lending.
I never understood why 10 year trailing earnings was meaningful.
Cash, or better, TIPS.