Context relevant estimates suggest larger, not smaller, fiscal multipliers.
In its newly released Budget and Economic Outlook, the CBO has published new estimates of potential GDP. In conjunction with the most recent estimate of GDP, it appears that we are making halting progress on shrinking the output gap.
Figure 1: Log GDP (blue), CBO baseline projection under current law (red), and potential GDP (gray bold). NBER defined recession dates shaded gray. Source: BEA, 2012Q4 advance release, CBO, Budget and Economic Outlook, February 5, 2012, and NBER.
With the output gap still relatively large (6.1% as of 2012Q4, in log terms), and monetary policy accommodative, it seems to me we should re-evaluate what policymakers consider the relevant fiscal multipliers. I’ve been thinking about this as I’ve written a new survey on fiscal multipliers. The interesting point is that, as I caught up on the newer and newer literature, I found that the consensus moved toward larger and larger fiscal multipliers. From the paper:
4.3 Monetary regimes (inflation targeting, zero interest rate bound)
Perhaps the most important insight arising from the debates over fiscal policy during and after the great recession is that the multiplier depends critically on the conduct of monetary policy. This insight is obvious if one thinks about policy in a standard IS-LM framework, where the interest rate is constant either because of accommodative monetary policy (Davig and Leeper, 2009), or because the economy is in a liquidity trap. Christiano et al. (2011) provide a rationale for this effect in the context of liquidity trap in a DSGE.
Coenen et al. (2012) show that in DSGEs, the degree of monetary accommodation is critical. When central banks follow a Taylor Rule or inflation forecast based rules, then multipliers are relatively small. However, when monetary policy is accommodative – that is interest rates are kept constant – then the cumulative multiplier is greater.
This insight is of particular importance because estimates of multipliers based upon historical data are likely to be less relevant in current circumstances, where interest rates have been kept at zero since 2008.
There is some evidence that the effects of fiscal policy in Europe have been unusually large in recent years (see Blanchard and Leigh, 2013). One of the reasons is that the zero lower bound has prevented central banks from cutting interest rates to offset the negative short-term effects of fiscal consolidation.
See also Reichling and Whalen (2012) for discussion. Returning to the survey:
5. Asymmetric fiscal effects
Many of the earlier studies assumed the impact of fiscal policy was homogenous across different states of the economy. Recent work has sought to relax this assumption. Given that the size of the multiplier is more relevant in certain circumstances than others, accounting for heterogeneous effects is critically important.
5.1 State-dependent multipliers
The demand side interpretation of the multiplier relies upon the possibility that additional factors of production will be drawn into use as demand rises. If factors of production are constrained, or are relatively more constrained, as economic slack disappears, then one might entertain asymmetry in the multiplier.
Auerbach and Gorodnichenko (2012a, 2012b) and Fazzari et al. (2012) use VARs which allow the parameters to vary over expansions and contractions. Baum et al. (2012) condition on the output gap. The common finding in these instances is that multipliers are substantially larger during recessions.
To highlight the variation in the multiplier for the US, I reproduce Figure 5 from Auerbach and Gorodnichenko’s (2012b), which plots their estimates of the multiplier over time.
Source: Auerbach and Gorodnichenko (2012b).
Hence, fiscal multipliers are largest exactly at times when expansionary fiscal policy is most needed. Estimates of multipliers based on averaging over periods of high and low activity are hence useful, but not necessarily always relevant to the policy debate at hand.
…
5.3 Ordinary versus stressed financial systems
Historical estimates of the fiscal multiplier also condition on data when the financial system is operating normally, or is at least not highly impaired. However, the financial conditions during the crisis were arguably abnormal. To the extent that credit constraints were more binding (e.g., Eggertsson and Krugman, 2012), households could be expected to behave in a more “Keynesian” fashion, with less reference to “permanent income”. This would tend to result in a larger multiplier. See also Fernández-Villaverde (2010).
Corsetti, Meier, and Müller (2012), confirm empirically (using VARs) that during times of financial crisis, fiscal multipliers are larger. They conjecture that liquidity constrained households are more pervasive during crises. They add the caveat that this finding holds true when public finances are strong.
Two Observations: Academic and Policy Related
First, it is interesting that many types of models, including DSGEs, when modified to account for accommodative monetary policy, indicate larger multipliers than found in the previous – pre-liquidity trap – literature. Furthermore, typically empirical estimates allowing for heterogeneity find that fiscal multipliers are larger during periods of large economic slack than otherwise. These findings will not be surprising to Econbrowser readers, as I have noted these findings over the past few years. These findings will be surprising to those who ignore the academic literature because most of the findings conflict with their priors. (e.g. here).
Second, given that sequestration is likely to proceed, then we are adding additional fiscal drag on top of that already in the pipeline. With larger multipliers, the negative impact might very well be larger than expected on the basis of conventional multiplier estimates (e.g., those at the midpoint of the ranges cited by CBO). Here is Goldman Sachs’ latest estimates of impact per year.
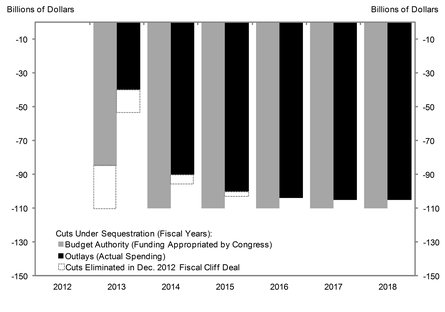
Source: Goldman Sachs, “Q&A on Our Revised Federal Spending Assumptions (Phillips),” US Daily, February 5, 2013. [not online]
With the output gap as large as it is, we should be pushing fiscal policy the other direction. At the very minimum, we should not implement cuts in current expenditures; rather they should be targeted at out-year expenditures, when output is closer to potential. We knew this before; now we have even more reason for holding to this view.
You had asked me to read Barro, so I asked Prof. Barro to recommend his latest on multipliers. Here’s what he recommended:
http://qje.oxfordjournals.org/content/126/1/51.full#T2
Based on defense spending over a long time period in the US, he is hard pressed to find a multiplier much above 0.7, even on a cumulative basis.
He also argues that there is no agreed framework for assessing non-defense spending, and I have to agree. The estimates for multipliers seem all over the board to me. Take for example “How Big (Small?) are Fiscal Multipliers?”, Figure 11: Cumulative multiplier: Highly indebted countries. bottom chart on p. 46 (http://www.imf.org/external/pubs/ft/wp/2011/wp1152.pdf) Now, do I really believe that a highly indebted developing country has a multiplier of -4.7? Does government spending of $100 million really destroy $470 million of GDP in such a case? I have my sincere doubts–not that the statistics are wrong–but that they are measuring what they appear to be measuring. What’s being measured here is a fiscal environment, not the benefit of incremental spending.
As for the multiplier today, the chart above (Fig. 5) suggests it is around 0.5. Within a year of the end of each recession on the chart, the multiplier has fallen well below one. Ceteris paribus, that’s where it should be now.
On the other hand, I think the multiplier during and just after the recession had to be close to one. I don’t think that there was any compelling evidence of crowding out.
But I doubt it was much greater than one, either. What was the composition of the deficit? Primarily increased transfer payments and tax cuts–and virtually all of that can be anticipated to have been spent on consumption. It should be no surprise that stimulus has little lasting effect on GDP and that all that remains is the associated debt.
Now, the declining marginal utility of wealth and income may be a good reason for counter-cyclical spending. Income matters most when you have the least. But that’s not the case you’ve argued.
If you’re arguing that somehow the stimulus will pay for itself, well, I think it’s becoming increasingly apparent that it won’t.
Steve Kopits: I said read a textbook, not an article. A textbook lays out various approaches to interpreting a given phenomenon — and in his textbook he explains various approaches. (I mean, if you wanted to learn about mechanical engineering, would you read an article, or a textbook? If you wanted to learn about stochastic calculus, would you read an article or a textbook…?)
Regarding his paper, I will merely note there was something called “rationing” during WWII.
You will note that in the Auerbach and Gorodnichenko paper, the multiplier stays high for a longer period after the end of the recession than it does for the pre-1990 period recessions. I suspect that this will hold true for the recent period when the data is finally extended so that estimation can encompass 2012.
At the very minimum, we should not implement cuts in current expenditures; rather they should be targeted at out-year expenditures, when output is closer to potential.
I couldn’t agree more. Why does the same logic not apply to the tax revenue side? I haven’t seen anything to suggest that Obama’s call for higher tax rates and new limits on deductions will occur in the out-years.
Menzie This week there is a new NBER paper by JDH’s colleague Prof. Ramey et al. As with her earlier papers, Ramey does not find strong evidence for a fiscal multiplier using “news” events of military spending.
http://www.nber.org/papers/w18769
The Ramey paper has some problems that it shares with a lot of papers that attempt to use defense spending shocks to estimate multipliers. Ramey uses defense spending in the NIPA tables, which is a problem because what NIPA reports is not “spending” in the relevant sense of authorizations or obligations with vendors (it’s the latter that actually “stimulates” economic activity). What NIPA reports as spending is closer to Treasury disbursements as reported by DoD finance and accounting systems. In fact, BEA has a paper that describes how they estimate defense spending. Disbursements always occur with a lag…sometimes a very long lag. And more to the point, disbursements always occur after the shock to economic activity has already occurred. No wonder Ramey found multipliers less than 1.0!!! Disbursements provide no more economic stimulus than reimbursements from one party to another, which are best thought of as transfer payments. Of course, Ramey is not alone. Barro’s paper suffers from the same problem. And those papers also ignore the very different time lags between authorization and obligation. The time lag for operations and maintenance is very short, but the lag for weapon system acqusition is 3-5 years between Congressional authorization and obligation with the vendors. For example, the upcoming sequestration is being interpreted by OSD to apply to unobligation authorizations going back to FY2011 that have not been “spent” yet.
To get a feel for the disconnect between what Ramey is measuring and what she should be measuring, compare the defense fiscal year authorizations in the OMB historical tables with the defense expenditures in the OMB tables. The expenditures tables are very close to the NIPA expenditure tables (after adjusting for fiscal year versus calendar year). The point is that you just should not use NIPA tables when looking at defense shocks to estimate multipliers.
The evidence that multipliers are greater than 1.0 come from “natural” experiments that track unexpected shocks to military spending (there’s a study on this for small Italian cities) and unplanned road construction projects. These studies show local multipliers greater than 1.0 even after allowing for leakages out of the local economy.
If you wanted to learn about stochastic calculus, would you read an article or a textbook…?
Actually, when I first learned stochastic calculus I got the most out of Obstfeld’s two papers:
http://elsa.berkeley.edu/~obstfeld/ftp/perplexed/cts4a.pdf
and
http://elsa.berkeley.edu/~obstfeld/ftp/perplexed/cts4b.pdf
tj So now you’re complaining that Obama isn’t enough of a tax-and-tax liberal??? Actually, I agree that taxes should go up after the economy fully recovers. Obama’s pledge to make the Bush tax cuts permanent for the middle class was a big mistake. Eventually we will need another round of tax hikes on the wealthy and some combination of income tax hikes and a VAT for the middle class. A carbon tax would be a good idea as well, although a good case can be made for making the carbon tax reimbursable on a per capita basis.
So what do you really have, Menzie?
I’ll spot you a multiplier of 1.0 during the recession–that’s what automatic stabilizers are all about. You’re supporting consumption, by and large. But would we expect this to have some lasting impact? I don’t think so.
Now, a number of these folks find a multiplier greater than one during a recession. That’s great. The recession ended four years ago. So based on the chart you present above, half of stimulus spending since Q3 2009 will never even make it to GDP!
And then there’s the debt. None of the articles I’ve seen deals with the source of the stimulus–which in this case was debt. If the multiplier is one, then the spending increases GDP by the same amount, no? And if that’s true, then the spending creates as much value as the debt incurred to produce it. In other words, the spending merely brings consumption forward in time. (But if I’m wrong, please correct me. I’ve got to believe you have an intermediate macro text handier than I have.)
Finally, we borrowed 30% of GDP, and the best GDP growth can do from 2010 is 2.4%, 2.0% and 1.5%? Do I believe Auerbach that “the average government spending multiplier over three years is about $2.3”? Does that mean that a 10% deficit created 23% of GDP over the next three years? Really?
Steven Koptits Forget stochastic calculus, let’s just stick with freshman differential calculus. The size of the deficit as a percent of GDP has nothing…zilch…nada to do with the fiscal multiplier. The multiplier is a function of the change in GDP with respect to the change in government spending…or dY/dG.
You should also read up on the Ricardian Equivalence Hypothesis, because that’s the argument you’re making when you tell us that spending creates as much value as the debt. And would you say the same thing if the private sector borrows money to build a refinery plant? The company takes on debt…is that bad?
Finally, reread some of the papers. The key isn’t just whether or not the economy is in recession, but the size of the output gap and the response of the central bank. No one doubts that the fiscal multiplier is low if the Fed decides to sterilize any stimulative effect by raising interest rates. Today’s discussion is all about fiscal multipliers when the Fed is operating at the zero lower bound and there is a persistent output gap.
2slugs,
Why oh why would you tax carbon dioxide? There is no catastrophic global warming. Even some of the die hard warmists are coming around to the idea that the max increase from a doubling of CO2 is
Menzie: This entire analysis is predicated on believing we have “accommodative monetary policy.” Care to define what that means to you and maybe even (gasp) support the statement?
The secret sauce in these regime-switching VaR papers is the identification assumption that G occurs first, then T and Y follow. What is the justification for that? G, T, and Y are endogenous and that’s very hard to get around. Ramey and Barrow are trying to deal with the endogeneity problem seriously rather than making convenient assumptions.
But let’s suppose there papers are right. What of it? They would have established that there is a muliplier for relatively small changes in government spending. But by conventional Keynesian estimates we need a trillion. Numbers like these always remind me of the movie “Brewster’s Millions” in which Richard Pryor must spend $30 million in 30 days to get his inheritance of $300 million, a multiplier of 10 for you new Keynesians out there. Anyone can throw away $30 million of course. The trick is that Brewster has to spend it sensibly and part of the comedy is how hard it is to do that.
The same is true for the government. Good luck spending a trillion dollars sensibly in a couple of years. Much of the problem with the last stimulus was that it was executed so incompetently (transfers plus temporary tax cuts), so that Keynesian theory wasn’t really even tried.
2slugbaits,
I’m not sure what you are talking about but it appears you are making up your facts yet again. The defense spending numbers are culled from Treasury’s MTS, DOD documents, judgmental estimates, etc. To be counted, actual expenditures have to happen during the time period in question. NIPA tables are explicitly adjusted for timing differences between outlays and expenditures. Can you point to anything to back up your point on NIPA tables?
deficit in thought, more than spending….dG is change in government spending on GOODS AND SERVICES…not paying people not to work, or getting on SSI. These non spending items are not stimulative, they are just transfers.
There are two behavioral quirks which drive macro policy folks: 1) money illusion, 2) non-ricardian equivalence. In behavioral finance, folks like Odean and Bernartzi and Thaler have strong normative arguments about informing investors about their behavioral issues. Why is it the case that macro folks don’t want to inform workers that repeated stimuli or money increases will reduce their real wages, as has happened since 1970 or so.
Slugs –
I have conceded a 1.0 multiplier in a slack economy. I have conceded that there are good social reasons for counter-cyclical spending.
But we seem to be debating whether such stimulus “pays for itself”. Correct me if I am wrong, but if the multiplier is 1 or less, then any such stimulus financed by debt only brings forward consumption, nothing more. That may not be a bad thing in a recession, but it doesn’t pay for itself.
As for investments, sure, let’s make them. A refinery is a terrible investment right now, but such an investment would be done on a rate of return basis. And government investment can also be done on an even broader social rate of return basis. Education and infrastructure spending can both fit the category.
By contrast, food stamps, disability, unemployment insurance, social security, increased income from tax holidays and Medicare count essentially as pure consumption. And that’s what the deficit financed, by and large.
So, the point I am making is that there is scant evidence that the massive stimulus to date has “paid for itself”. It’s simply debt that will have to be serviced in the future.
With some notable exceptions (especially Steven Kopits), the underlying assumption generally continues to be that there is no inherent problem with a virtually infinite rate of increase in our consumption of a finite fossil fuel resource base. But as M. King Hubbert noted many decades ago, energy and matter are finite, while the central banks can monetize debt, “To infinity and beyond.”
In any case, we can argue about what will happen regarding global net exports of oil, but there is no real debate about what has happened.
I think that the most accurate assessment of the global situation is that net oil importing OECD countries like the US are gradually being priced out of the global market for exported oil as the developing countries, led by China, have consumed an increasing share of a declining post-2005 volume of Global Net Exports of oil (GNE*).
Our data base shows that the ratio of GNE to Chindia’s Net Imports of oil (CNI) fell from 11.0 in 2002 to 5.3 in 2011, and the rate of decline in the ratio has accelerated in recent years, falling from 8.9 in 2005 to 5.3 in 2011. At the 2005 to 2011 rate of decline in the GNE/CNI ratio, in only 18 years the Chinidia region alone (China + India) would theoretically consume 100% of GNE:
http://i1095.photobucket.com/albums/i475/westexas/Slide03.jpg
Available Net Exports (GNE Less Chindia’s Net Imports):
(2002-2005 rate of change: +4.4%/year; 2005-2011 rate of change: -2.2%year)
http://i1095.photobucket.com/albums/i475/westexas/ANE_02-11_gap-1.jpg
Note that the GNE/CNI ratio fell from 2002 to 2005 because the rate of increase in CNI exceeded the rate of increase in GNE.
Rising US oil crude oil production (to a level well below our 1970 peak rate) certainly helps, but it’s a near certainty that we finished 2012 with the highest overall decline rate from existing wellbores in US history, and I have a hard time believing that thousands and thousands wellbores quickly headed toward stripper well status–10 bpd or less–will make a material long term difference in the global net export situation.
I think that the US is temporarily in a better position supply wise, but ever increasing decline rates in existing wellbores will catch up with us sooner or later.
In any case, I don’t think that an average American consumer, who is not directly or indirectly employed in the domestic oil business, is in a better position, since the fact remains that the global (Brent) price of oil is averaged $112 in 2012, versus $25 in 2002.
And while WTI prices are certainly lower than global prices, the WTI price is really only relevant to Mid-continent producers and refiners. Based on the WTI crack spread versus Brent crack spread (the gross profit from refining a barrel of WTI is about $13-$15 higher than the gross profit from refining a barrel of Brent), US consumers (even in areas where refiners pay WTI prices) are very much exposed to global crude oil prices. Basically, Mid-continent refiners are paying WTI prices for crude, but largely charging Brent based prices for refined products.
In my opinion, net oil importing OECD countries have gone increasingly into debt, from real creditors and accommodative central banks, trying to keep their “Wants” based economies going, as the developing countries, led by China, have consumed an increasing share of declining volume of post-2005 Global Net Exports of oil.
The GNE/CNI ratio versus global public debt, through 2011 (Economist Magazine):
http://i1095.photobucket.com/albums/i475/westexas/Slide01.jpg
*Top 33 net exporters in 2005, BP + Minor EIA data, total petroleum liquids
So if I understand well, multipliers are higher when monetary policy is relax-ed OR interest rates are rigid, either because we’re in a liquidity trap, or… because we have a crazy central bank (BCE) in charge? Anyone could clarify this point further to me?
Here’s the math:
A multiplier addresses only incremental government spending. I’ll assume that an increase in the Federal deficit equates to increased spending. Thus, from 2007, the Federal deficit and change in the deficit (a proxy for dG) are as follows:
2007: $161 bn, —
2008: $459, dG of $298 bn
2009: $1413, $954 bn
2010: $1293, $-120
2011: $1300, $7
2012: $1089, -211
2013: $901, $-188
Further, I use Auerbach for multipliers, thus
2008, 2009: multiplier of 2.3, over three years
2010: 1.0, over two years
2011, 2012: 0.5, over 1 year
Do the math, and the GDP benefit of such spending, including multipliers, is $2.6 trn. The debt incurred to achieve those benefits is $5.5 trn (exclusive of the $161 bn level of 2007, which is not considered as part of the stimulus).
Thus the benefits costs $2.9 trn more in debt than the benefits derived–and this is using Auerbach’s multipliers. This gives us a debt weighted multiplier of less than 0.5–even in a deeply recessionary environment.
Over to you, Slugs.
Should one be willing to rob a familiar object from his owner one would displace the object by few centimetres everyday. The owner eyes would slowly get used to the absence of the object and it would mark the time for its real disappearance. The same goes in economics and finance when hammering peripheral subjects may lose track of the essence.
It is debts private, public .It is balance of payment, and for the creditors the solvencies of their debtors. It is structural, high operating cost, administrative burdens, lack of labour flexibility, high leverage of corporations debts.
The wonders of the recoveries are Latvia, Estonia their common features low public debt to GDP. Iceland a recovery that went through the repudiation of the arm length transactions with its financial industry.
The saga are known among them, Greece which after a write off of around 75 Pct of its public debt is still depending on its creditors.
The empirical data are recorded
IMF Very few recoveries are taking place after a break up of the financial industry, currencies crisis and a debts flux.
1994 paper by Tamim Bayoumi and Barry Eichengreen as iintroduced by Econbrowser post: The Euro Zone Crisis: Political and Economic Perspectives
Years after the crisis, the search for multipliers fiscal and monetary is still not bearing success as Public debts /GDP are expanding, the same in the USA and in Japan and UK.
So far if Mundell theories and open conclusion on the most adverse case,a Balance of payment deficit, unemployment and low I-S, L-M, negative real interest rates, has been erased from the text books besides commodities countries there has been no evidence of the contrary.
In finance and business those cases are calling for a debts repayment schedule and rescheduling. We are still debating a fiscal multiplier that has positive effect for the less indebted countries.
Pr Taylor website « Economics one » offers a concurring conclusion
Investment-Unemployment Link Still On Track
2slugbaits: BEA describes the means for estimating defense spending here. Regarding the Ramey papers, it seems like substantial measurement error is introduced in the outlined process, but I suspect the bigger issue is trying to infer shocks from a highly volatile series. The question is whether a multiplier can be reliably extracted from such a volatile process (since behavior should be different from something where the shocks are somewhat persistent). When combined with the measurement error — well, who knows.
Steve Kopits: If you look at the pattern after each of the last “jobless recoveries” (starting in ’91, ’01), you will see that the multipliers stay large for a number of quarters, roughly corresponding to the duration of a large output gap. Well…that suggests that a multiplier of 1.5 (where did you get 1.0?) is probably more relevant than the 0.5 you cite.
I cannot understand your “math”. I think what you are getting at is the calculation that DeLong and Summers (2012) undertook, in terms of figuring out whether govt spending is self financing in PV terms. I suggest you check out the math there, given real interest rates are negative (or do you think that’s a figment?).
Jeff: I think I define accommodative monetary policy the way most economists do these days: keeping the interest rate constant (or dropping it) as a fiscal impulse is applied, such that the interest rate is less than that implied by a Taylor rule or an inflation forecast based rule (this is the definition in for instance the Coenen et al. paper published in AEJ: Macro cited in the survey. What’s your definition?
If I use your multiplier, the effect is even worse, as dG is negative for the out years (2011-2013). The debt weighted multiplier falls from .47 to .46–worse, but not much worse.
I assumed a zero nominal interest rate. The result would be worse with any positive interest rate.
I’ll read Summers on the train. But much of it deals with hysteresis, in which I am not a great believer. (I hire someone when I need them; the first six months of employment is a write-off anyway.) But if I were a great believer in hysteresis, then I certainly wouldn’t want welfare or unemployment insurance–you want to motivate people to get a job!
Bottom line: The stimulus will not pay for itself–not even close–even under the most aggressive multiplier assumptions. What you see is what you get, and what we see is a tower of debt and truly mediocre growth rates.
Here’s the issue. The year when the deficit starts to fall, dG as a practical matter goes negative for that year (although not necessarily previous years). Thus, you can be borrowing a pile of money, but still have a negative dG! That’s where the stimulus model falls apart even under hefty multipliers: the debt accumulated after the end of the recession.
Now, you could make “foregone growth” assumptions to beef up your case, and I imagine that’s where this conversation is headed.
tj Taxing carbon sounds like a win/win to me. Raising revenue, reducing a social “bad” and making for more efficient market allocations with less distortion by internalizing all costs. What’s not to like?
There may well be some truth to the claim that some of the tax cuts went towards deleveraging rather than consumption; although the empirical evidence to date suggests otherwise. Still, that was probably true with the 2001 tax rebate. In any event, that’s an argument against the effectiveness of tax cuts. The issue here is mainly about government expenditures, which have a different multiplier. And I don’t know where you get this stuff about spending having to be well targeted to be effective. It would be great if spending was well targeted towards infrastructure because that would have an added supply side effect; but what we’re talking about here is just the demand side and for that there is no requirement that spending be well targeted to have a multiplier effect greater than 1.0.
Rick Stryker I am well aware of the BEA’s explanation. BEA is mainly talking about stuff that works within the O&M accounts, such as adjusting for the timing of pension payments. That is not the problem that I am referring to. The problem that I’m addressing has to do with the disconnect between Congressional authorization, budget execution (i.e., when the money is “obligated” and and a contract is signed), and disbursement. And these are problems for the Procurement Appropriation (PA), RDT&E and Military Construction categories and not O&M accounts. That’s because O&M accounts have a 1-year life and there is no significant gap between authorization and budget execution. But that’s not true for the other categories. For example, Congress might authorize the procurement of a new aircraft carrier in FY2004. That authorization would show up in the OMB historical tables for FY2004. But that particular funding category has a five year budget life and may not be executed unitl FY2008. The economic impact would be at the time of budget execution. The BEA tables rely upon Treasury disbursement statements and there is another 5-years allowed for disbursement. So it’s entirely possible for a project that was authorized in FY2004 to show up in the NIPA tables in FY2013. And things get really byzantine when you start talking about procurement of spares and repair parts because those are managed under a revolving working capital fund that is based on expected O&M budgets two years in the future. If Prof. Ramey and Prof. Barro think they are accurately capturing defense spending in response to a news shock, then they are sadly mistaken. Just a quick comparison of the OMB authorization tables with the BEA NIPA tables should have told them that something was wrong with their theory of how the Pentagon budget and execution process works.
Steven Kopits No, you cannot equate a change in the deficit with a change in government spending. Some of the increase in the deficit is due to automatic stabilizers and transfer payments. Some of the change in the deficit is due to tax cuts. And some of the change is due to government spending on goods and services. And don’t forget that the tax cut multiplier is lower than the spending multiplier. For example, check the Romer and Bernstein paper that estimated a tax cut multiplier of less than 1.0. Also, the spending component of the ARRA was only about $450B spread out over three years. That’s the “dG” you should be looking at if you want to think in terms of Menzie’s recommended textbook explanation.
Menzie Yes. I’m aware of the BEA explanation. They are talking about something completely different that pertains almost entirely to O&M accounts. I’m referring to the peculiar nature of certain “colors” of defense spending for hardware and construction costs that have a budget and disbursement life that crosses fiscal years. For purposes of estimating the fiscal impact of an increase in defense spending you have to look at the timing of budget execution rather than authorization (as shown in the OMB tables) or Treasury disbursements (as shown in the NIPA tables).
2slugbaits,
I asked you to back up your assertions and you’ve responded by repeating them in more detail. The BEA adjust for the timing of everything, including aircraft and ships, not just pension payments. The gory details of how defense spending is constructed are in their methodology doc available here (see section II):
http://www.bea.gov/national/pdf/mp5.pdf
The 2slugs BS flag is in full flight. Ask him the differences between Congressional authorization, budget execution, budget, appropriation, obligation, disbursement, expenditure, and payment amounts. He’s blowing smoke!
Then he goes on about the deficit with: “deficit is due to automatic stabilizers and transfer payments”. From the OMB tables the deficit is very simple: revenues in and disbursements out. There are a multitude of revolving funds, special accounts, even multi-year obligations, but they all result in disbursements which get paid out of revenues.
Steve Kopits, his whole answer to you is BS. You appear to be on the right track re: multipliers and their payback.
Dear Menzie,
I would like your opinion on two points.
1) In reading your survey, you did not mention Ray Fair’s models. They would seem to offer a quick and dirty structural macroeconometric model that would be relatively invulnerable to the expectations problems, etc., that supposedly plague standard structural macroeconometric models, which I think are vastly exaggerated in any case. Do you have any opinion on that, or is there some, simple, stupid model that you prefer for someone trying to estimate effects quickly?
2) It would seem that cross-section models on U.S. states would offer some evidence on multipliers. If a state wastes money, the multipliers would be low, but if it makes a valuable investment – valuable in the usual GDP sense of increasing spending or lowering costs – the multipliers would be higher. The whole debate, all of it, is an argument over the assertion that government spending can’t be valuable in this sense, so let’s get rid of government. Thus, I think regional evidence would be valuable, by increasing the information base. Do you think the lower quality of the data would offset this gain?
2slugs
the tax cuts went towards deleveraging
Strawman, I never mentioned tax cuts. If G stimulus spending goes to Firm S and they use the incremental dollars to pay down debt, then multiplier ~ 1. If Firm S passes some dollars on to HH J in the form of wages, and HH J uses the incremenatal dollars it to pay down debt, then the multiplier ~ 1. There is no crowding out in this case. However, a form of ‘rationing’ occurs when federal debt reaches current levels. Policy makers are forced to reduce spending on some government programs in order to maintain the rate of spending growth in other government programs.
Why are you so quick to demand new taxes? Tax increases, other than those driven by economic growth, should be a last resort. It seems to be your ‘go to’ solution to every fiscal problem.
Most spening cuts currently being considered are above the the prior year’s level, but below the budgeted level. That seems like a fair approach. In these cases, government programs still get more federal dollars than they got last year.
reducing a social “bad”
Warming below 2C has a net benefit. As sensitivity estimates fall, we should subsidize CO2 emissions according to your logic.
Slugs –
We can run this analysis just with increased government spending if you like.
Through 2012, government spending increased by $809 bn over 2007 levels. The deficit increased by $928 bn over 2007 levels.
The cumulative deficit, excluding the deficit levels of 2007, increased by $5.4 trn. (I am using this as a proxy for debt.)
I have used the following multipliers for increased government spending and increased deficits.
2008, 2009: 2.3 over three years
2010: 1.8, over two years
2011: 1.5, two years
2012: 0.8, two years
2013: 0.5, one year
Using these numbers, through 2012, the debt weighted multiplier for increased government spending is 0.37, for government deficits, 0.44.
Thus, your argument that only increased government spending should be counted in fact hurts your cause, as government spending increased by less than government deficits. Personally, I think deficits are a fairer representation, as I don’t see much difference in increased govt spending versus reduced taxes in terms of stimulative effect.
Importantly, the debt weighted multiplier declines over time, for the very reasons that you yourself have emphasized: The multiplier affects only the increment, but the entire value of the deficit must be borrowed again every year. Thus, the debt weighted multiplier will see secular decline–the longer one waits to balance the budget, the worse the use of funds.
Julian Silk: I couldn’t mention all the models in a survey constrained to 4000 words. I implicitly lumped the Fair model in with other structural macroeconometric models of the Neoclassical Synthesis tradition/Cowles Commission tradition. (Note I didn’t mention explicitly for instance DRI, WEFA and descendents, nor model consistent expectations models such as the McKibben Sachs MSG model — not because they aren’t relevant, but I just couldn’t be exhaustive.)
Regarding state level data, I discuss the Nakamura-Steinsson results, and list in footnote 6 studies on “subnational multipliers”.
Rick Stryker I suggest that you take another look at your own link. Specifically, look at Table II.5. What is the source data for hardware expenditures? Hint: “disbursements.” That’s exactly what I’ve been arguing. I realize that you’re not fluent in G8-speak, but disbursements are payments, and those payments can lag contract obligation by 5 years, and contract obligations can lag Congressional authorizations by up to 5 years (depending on the weapon system).
Just as a sanity check, look at NIPA Table 1.1.5, Line 23. Compare year 2006 with year 2011. Do you really believe nominal defense spending today is 31% higher than it was at the height of the Iraq War when the GOP controlled the White House and both houses of Congress? Is that even plausible? Current ground system operating tempos are roughly one-sixth what they were 5 years ago but somehow spending has increased by 31%? Get real. What you’re seeing are the effects of delayed disbursements from contracts that were let several years ago. BTW, I think that explains the surge in disbursements in CY2012Q3. The clock was running on disbursement lifespans of many contracts and vendors needed to deliver before 1 October. The G8 folks have to alert the Treasury cash management folks to the likelihood of vendor delivery spikes. Anyway, the stimulus to economic activity happened at the time of contract award, not at the time of Treasury disbursement, and that’s what Ramey’s paper gets wrong.
FWIW, if you really want to learn G8-speak, then you might want to see if you can sign up for one of the public online classes in defense financial management: http://www.dau.mil
CoRev Just a refresher…OMB is all about budget development, budget apportionment, budget execution and budget reprogramming. The Treasury is all about receipts and disbursements.
Steven Kopits Seriously. Go get that intermediate macro textbook. Before you try launching into realworld estimates of the fiscal multiplier it’s best to take a break and learn the comparative statics. Do that an you will understand why the tax cut multiplier is less than the spending multiplier.
Jared Bernstein today:
Senator John McKeynes, Republican of Arizona, on the impact of military cuts… The Senator said the military side alone would eliminate 350,000 jobs directly, and 650,000 more that depend on the government programs.
So, not only is this pure Keynesian analysis, but the Senator is recognizing both the direct and indirect effects of the cuts of jobs. In other words, he’s got a multiplier, and it’s a big one!
Slugs –
Here are the numbers assuming a multiplier of 1.5–again the result is progressively worse than under the assumptions I have used.
In such a case, both the dG and dD (deficit) effects total around $1.4 trn, with an incurred incremental debt of $5.4 trillion. The debt weighted multiplier is thus 0.26, down from around 0.44 based on Auerbach multiplier assumptions.
Thus, purchasing $1 of GDP growth will cost you $4 of increased debt.
But maybe I’ve calculated something incorrectly. I’m happy to provide you the spreadsheet. Send me an email.
Joseph –
These sorts of numbers are typically produced for political purposes, and should be taken with a grain of salt. But I could see a 1-to-1 ratio, implying a gross multiplier of -2. I have used 2.3 per Auerbach for increased spending.
However, probably half these people will have jobs within a year; most within two years. At this point, they will also start to pay taxes. So the total returns to these layoffs should be positive. Thus, the long term multiplier might actually be positive, not negative.
Having said that, the economics of the military are always tricky. If those folks aren’t needed for our defense, then it was pure money saved. If, by contrast, we needed them, then it was a very poor decision indeed. Unfortunately, only future events will tell which view is correct.
Steven Kopits: “These sorts of numbers are typically produced for political purposes, and should be taken with a grain of salt.”
So do you mean that McCain in an ignorant old man who is oblivious to the contradictions in his policy statements from day to day (a few months ago it was “government doesn’t create jobs)? Or are you saying that McCain does know what he is talking about and is just blatantly lying to the public in order to mislead them into supporting his preferred policy?
2slugbaits,
You are saying that the BEA relies on Treasury disbursement tables and that the timing is all off as a result. That’s not what I read in the BEA methodology report. According to the doc, there are 3 ways to estimate the level of defense spending.
Their preferred method is “direct pricing” method. In that method, they collect quantities and prices of equipment and parts actually delivered and multiply them together to get the value.
When data is not available in some cases on price and quantity when using the direct method, they go to the ratio method in which they get detailed disbursement data from each military branch’s financial reports, not the Treasury, and essentially create ratios of missing spending to total spending to infer the information they don’t have.
For some categories of military spending they use the direct estimation method. In this method they do indeed use budget outlays and some disbursement data from DOD reports to estimate defense spending. But to quote from the methodology document:
“The directly-estimated method is based on a work put-in-place basis rather than on a delivery basis. Specifically, disbursements correspond closely to work done in a given quarter. Quarterly data on disbursements are available from financial reports.”
Thus, this long lags problem you are asserting does not appear to be there.
Rick Stryker I think we’re making progress. We both agree that what the BEA is trying to capture is the estimated date of final production. There are various ways to arrive at that date, but in general the date of production is roughly contemporaneous with the date of payment, which tracks with Treasury disbursement. And that’s fine. Afterall, GDP is supposed to represent the value added in the production of final goods and services. It’s even in the name: Gross Domestic Product. I think we agree that the way the BEA is gathering DoD consumption expenditure and investment data is appropriate for the purposes of NIPA accounting. To be clear, I am not arguing that BEA is doing anything wrong in the way they collect DoD NIPA data. My complaint is the way Prof. Barro and Prof. Ramey misapply that data because they are misinterpreting it. You cannot use Line 23 data in the NIPA tables to estimate when the positive fiscal shock happened because what Line 23 actually captures is the end result of that fiscal shock, which could have happened many years earlier. Now this is not a problem for most lines in the NIPA tables because the initiation of economic activity is roughly contemporaneous with the date of production. And even within DoD accounting that is true for spending within the O&M accounts. But it is not true for hardware spending and military construction spending because those authorizations do not expire with the fiscal year. Unfortunately for Prof. Barro and Prof. Ramey, their analyses focused on spikes in hardware and military construction spending and they relied upon BEA data for the timing.
2slugbaits: I don’t know whether you have the time or inclination, but you could further the scientific enterprise if you generated your own preferred time series measure. That might be a way to resolve this issue (i.e., if Ramey, and Barro, used your series instead of theirs).
Joseph –
I do not know the particulars of the case in question.
In my experience, these sorts of issues often prompt the commissioning of an analysis by some noted consultancy. I have seen such an analysis (related to oil and gas) from PwC which I recall as being quite good; and from IHS which I seem to recall as being overblown.
Now, McCain might say something like “experts tell us that another 650,000 jobs could be lost”, which could be a high case scenario, a completely overblown estimate from a by-the-pound consultancy, or actually a pretty good estimate. Based on what I’ve seen in DC, I would think one of the former two explanations the more likely. That’s politics.
Thus, McCain may not be lying, but merely quoting a study commissioned with the ultimate intent to protect the military jobs in question. Again, that’s politics!