“Peak oil is dead,” Rob Wile declared last week. Colin Sullivan says it has “gone the way of the Flat Earth Society”, writing
Those behind the theory appear to have been dead wrong, at least in terms of when the peak would hit, having not anticipated the rapid shift in technology that led to exploding oil and natural gas production in new plays and areas long since dismissed as dried up.
These comments inspired me to revisit some of the predictions made in 2005 that received a lot of attention at the time, and take a look at what’s actually happened since then.
Here’s how Boone Pickens saw the world in a speech given May 3, 2005:
“Let me tell you some facts the way I see it,” he began. “Global oil (production) is 84 million barrels (a day). I don’t believe you can get it any more than 84 million barrels. I don’t care what (Saudi Crown Prince) Abdullah, (Russian Premier Vladimir) Putin or anybody else says about oil reserves or production. I think they are on decline in the biggest oil fields in the world today and I know what’s it like once you turn the corner and start declining, it’s a tread mill that you just can’t keep up with….
“Don’t let the day-to-day NYMEX (New York Mercantile Exchange) fool you, because it can turn and go the other direction. I may be wrong. Some of the experts say we’ll be down to $35 oil by the end of the year. I think it’ll be $60 oil by the end of the year. You’re going to see $3 gasoline twelve months from today, or some time during that period.”
But others, like Daniel Yergin, chairman of Cambridge Energy Research Associates, were not as concerned. Yergin wrote on July 31, 2005:
Prices around $60 a barrel, driven by high demand growth, are fueling the fear of imminent shortage– that the world is going to begin running out of oil in five or 10 years. This shortage, it is argued, will be amplified by the substantial and growing demand from two giants: China and India.
Yet this fear is not borne out by the fundamentals of supply. Our new, field-by-field analysis of production capacity, led by my colleagues Peter Jackson and Robert Esser, is quite at odds with the current view and leads to a strikingly different conclusion: There will be a large, unprecedented buildup of oil supply in the next few years. Between 2004 and 2010, capacity to produce oil (not actual production) could grow by 16 million barrels a day– from 85 million barrels per day to 101 million barrels a day– a 20 percent increase. Such growth over the next few years would relieve the current pressure on supply and demand.
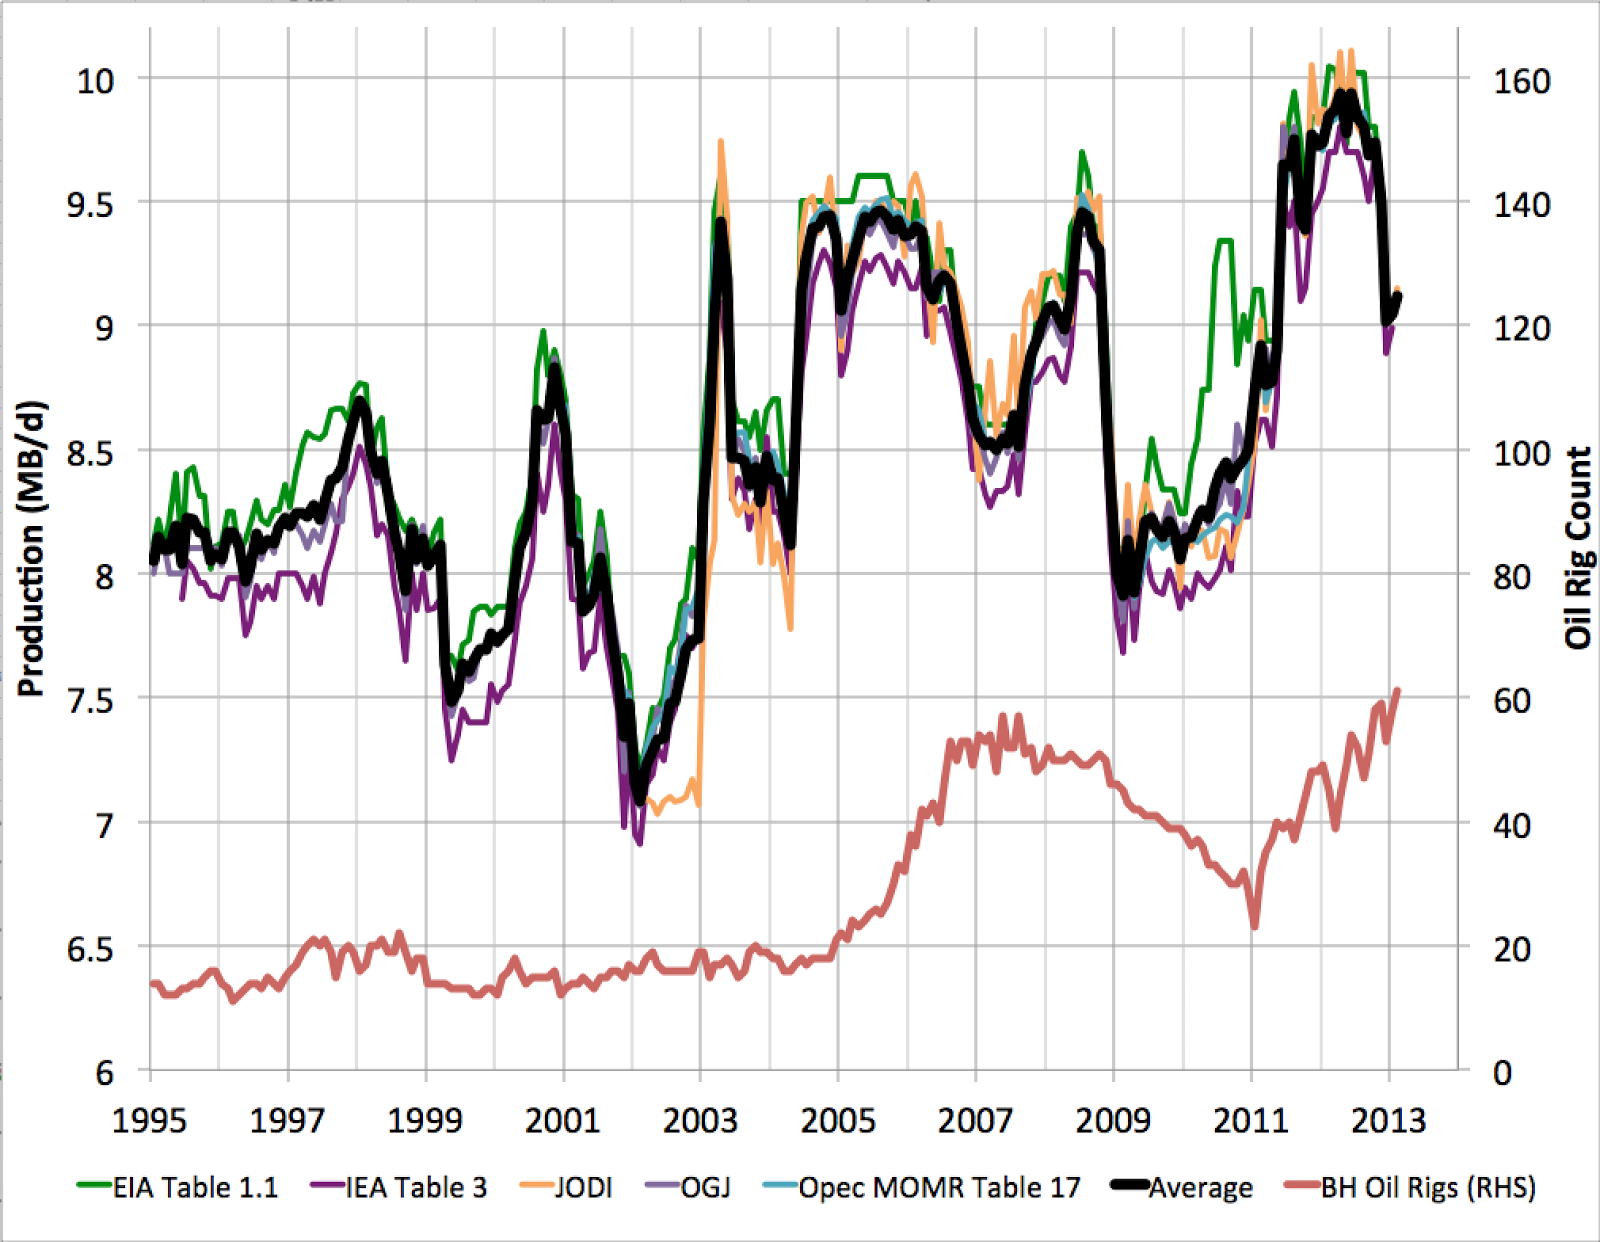
Let’s start by taking a look at what happened to global oil production in the years since those two very different views were offered. Total world liquids production as reported by the EIA had reached 85.2 million barrels a day at the time Pickens issued his pronouncement. It briefly passed that level again in June 2006 and June 2008, though mostly was flat or down over 2005-2009 before resuming a modest and erratic climb since then. The most recent number (December 2012) was 89.3 million barrels a day, 4 mb/d higher than where it had been in May 2005, and 12 mb/d below the levels that Yergin had expected we’d be capable of by 2010.

|
But more than half of that 4 mb/d increase has come in the form of natural gas liquids— which can’t be used to make gasoline for your car– and biofuels– which require a significant energy input themselves to produce. If you look at just field production and lease condensate, the increase since May 2005 has only been 1.7 mb/d.

|
Gasoline in the United States reached $3.00 a gallon in July 2006, just as Pickens had predicted it would. Today we’d consider that cheap.

|
Crude oil only took two months after Pickens’ prediction to reach $60/barrel. Brent is almost twice that today.

|
Knowing all the facts today, of the assessments offered in 2005 by Pickens and Yergin, which one would an objective observer characterize as having been closer to the truth? How could anyone come away with the conclusion that those who saw the world as Pickens did were “dead wrong”?
The rush to judgment seems to be based on the remarkable recent success from using horizontal fracturing to extract oil from tighter rock formations. Here for example is a graph of production from the state of Texas, one of the areas experiencing the most dramatic growth in tight oil production. In 2012, Texas produced almost 2 million barrels each day, up 800,000 barrels a day from 2010.

|
But Texas production in 2012 was still 1.4 mb/d below the state’s peak production in 1970, and I haven’t heard anyone suggest that Texas is ever going to get close again to 1970 levels. Production from any individual tight-formation well in Texas has been observed to fall very rapidly over time, as has also been the experience everywhere else.
|
Total U.S. production– including Texas, offshore, and every other state– is up 1 mb/d since 2012. But interestingly, that’s almost the magnitude by which Saudi production (which accounted for 13% of the 2012 total in Figure 2 above) has recently declined.
|
Stuart Staniford speculates that the recent Saudi cutback may have been a deliberate response to U.S. production gains in an effort to prevent oil prices from declining. On the other hand, his graph shows that Saudi effort (as measured by active drilling rigs) has ramped up significantly in the last two years.
Perhaps it’s the case that Saudi Arabia isn’t willing to maintain its previous production levels, or perhaps it’s the case that Saudi Arabia isn’t able to maintain its previous production levels. But whatever the explanation, this much I’m sure about: those who assured us that Saudi production was going to continue to increase from its levels in 2005 are the ones who so far have proved to be dead wrong.
Well, finally, a decent post.
The question arises whether oil consumption is falling due to peak demand or peak supply. The general view in the market–and this includes Citi, GS, the IEA and BP–is that it’s peak demand. Consumers, bless their hearts, just don’t want oil anymore. They love small under-powered cars and staying at home. Facebook and face time have changed the world!
Those in the peak oil camp see OECD oil consumption simply bid away by a combination of inadequate supply growth and strong underlying non-OECD demand. In this world, the OECD economies struggle, the price of oil stays high, and the oil supply remains unresponsive–which is actually what we observe.
As for Stuart: In what sense do you claim oil demand is inelastic? US (and OECD) demand is falling fast in the face of steady oil prices. That is very much price elastic demand.
During the recession, we toggled from inelastic to elastic demand. That’s a very important point! It means that the damage from a constrained oil supply is coming through volumes, not prices.
I’ll get around to writing something about this at some point. We have a couple billion dollars of commercial diligence to complete this month, as well as launching a new product line, so it will have to wait until we hit some clear air.
A trip down memory lane . . . with hypothetical headline and news story:
US Net Oil Imports Drop by Half in 9 Years, US on track to become net oil exporter
Of course, these data points pertain to the 1976 to 1985 time frame.
US crude + condensate (C+C) production hit a peak of 9.6 mbpd (million barrels per day) in 1970, and dropped to 8.1 mbpd in 1976 (EIA). Primarily because of Alaskan production coming on line, US C+C production rebounded, hitting 9.0 mbpd in 1985. Production then fell to 5.0 mbpd in 2008 (the decline was somewhat accelerated because of the 2005 Gulf Coast hurricanes). Production rebounded to 6.5 mbpd in 2012 (and to about 7.1 mbpd currently).
However, I suspect, and the EIA appears to concur, that the current rebound in US C+C production is likely to fall short of the 9.0 mbpd secondary peak that we saw in 1985, resulting in a tertiary peak in US C+C production. In other words, we are probably seeing a continuing “Undulatling Decline” in US C+C production.
And here’s the problem. Our supply base consists of discrete sources of oil like Alaska’s North Slope production:
http://energytomorrow.org/images/uploads/Annual_North_Slope_Production_and_Contribution_of_Fields.jpg
What surprises me about the almost daily “Peak Oil Is Dead” stories is the implication that production will increase virtually forever.
If the rate of increase in oil production from the North Slope did not increase forever, why would the rate of increase in production from the finite sum of discrete producing regions like the North Slope increase forever?
Take a look at the world per-capita level and rate basis 2005-08 and the 3-, 5-, and 10-yr. rates of change of crude and total liquids.
Then compare with real GDP per capita and production and the levels and rates of world cereals production and supplies.
Regressing and interpolating the change rates, the world has very little production and supply margins of safety per capita at a 1.2% rate of population growth and production and supplies that are growing slower than population plus replacement.
In support of the Professor’s comments . . .
Four Measurements of Oil Production
There are four key definitions of “Oil Production.”
(1) Crude oil (less than 45 API gravity)
(2) Crude + Condensate (basically gasoline)
(3) Crude + Condensate + NGL’s (Natural Gas Liquids), AKA total petroleum liquids
(4) Crude + Condensate + NGL’s + Biofuels + Processing Gains + All other liquids, AKA total liquids
Unfortunately, it appears that no one tracks US and global crude oil production (defined as less than 45 API gravity crude). All we have is regional crude oil data, e.g., Texas Railroad Commission (RRC) and OPEC. But based on regional data, it appears quite likely that there was no material increase in global crude oil production from 2005 to 2012, despite a doubling in annual global crude oil prices.
Even if we include condensate, I estimate that global Crude + Condensate production only increased from 73.6 mbpd in 2005 to about 75.5 mbpd in 2012 (a rate of increase of only 0.36%/year).
For purposes of this discussion, crude oil = oil with less than 45 Degrees API Gravity, and not crude + condensate (C+C).
Condensate and NGL’s (natural gas liquids, e.g., ethane, propane and butane) are byproducts of natural gas (NG) production, from both gas wells and from associated gas sources (NG produced along with oil). Condensate is basically natural gasoline, and it can easily be processed into finished gasoline, but it is not of much use in producing distillates, such as jet fuel and diesel.
Based on OPEC crude oil production data data and based on the high percentage of condensate production in many US shale plays, I suspect that virtually all of the post-2005 increase in global hydrocarbon liquids production (crude + condensate + NGL’s) comes from natural gas sources (as condensate + NGL’s).
As noted above, even if we count condensate, note that global C+C production was only up by about 2% in 2012, versus 2005, a rate of increase of about 0.36%/year.
Here is the question the Cornucopians don’t want to address: If we have virtually unlimited crude oil reserves, i.e., “Peak Oil is Dead,” why has a doubling in global crude oil prices, from $55 in 2005 to $111 or more in both 2011 and 2012, almost certainly not resulted in a material increase in global crude oil production?
I would argue that the post-2005 story has been one of higher prices causing (partial) substitution for crude oil (increased condensate, NGL’s and biofuels production), with probably no material increase in actual global crude oil production for seven straight years–even as the annual Brent price doubled from 2005 to 2011/2012.
Of course, there have been some efforts to substitute compressed and liquified natural gas for liquid fuels, but note that the EIA shows that US dry natural gas (NG) production has been virtually flat since April, 2011 Given the very high decline rates that we see in shale gas wells, there is a serious question as to whether the industry will be able to fully reverse a NG production decline and bring NG production back to prior levels, given that the underlying decline rates from existing wells are so much higher now than at the start of the shale gas boom.
Global Net Exports of oil
We have seen a material post-2005 decline in Global Net Exports of oil (GNE), which I define as combined net oil exports from the (2005) top 33 net oil exporters (BP + EIA data, total petroleum liquids).
In my opinion, increased production of the liquid substitutes only made an incremental difference, and not a material difference, in the global net export market, as the developing countries, led by China, consumed an increasing share of a declining post-2005 volume of Global Net Exports of oil.
Summary
So, in summary Brent doubled from $55 in 2005 to $111 in 2011 and $112 in 2012. In response, globally, regarding liquids production, we saw:
(1) Increased condensate, NGL’s and biofuels production, all less than ideal substitutes for crude oil.
(2) Probably flat global crude oil production.
(3) Declining Global Net Exports (GNE), with developing countries consuming an increasing share of GNE.
For more information on the outlook for Global Net Exports, you can search for: Export Capacity Index, a very long and detailed analysis of the global export market.
Regarding Saudi Arabia . . .
The Export Capacity Index (ECI):
A New Metric For Predicting Future Supplies of Global Net Oil Exports
http://aspousa.org/2013/02/commentary-the-export-capacity-index/
Excerpt:
Saudi Arabia, the world’s largest net oil exporter, is one of the 19 countries showing declining net oil exports from 2005 to 2011, and this case history is very interesting. (2012 data not yet available.)
The observed 2005 to 2011 rate of change in Saudi Arabia’s net exports was -1.5%/year, as their net exports fell from 9.1 mbpd in 2005 to 8.3 mbpd in 2011 (with lower values in several intervening years).
From 2005 to 2011, the Saudi ECI* ratio fell from 5.6 to 3.9, a decline of 30%. The extrapolated 2005 to 2011 rate of change in the ECI ratio, -6.0%/year, suggests that Saudi Arabia would approach zero net oil exports around 2034, with estimated post-2005 CNE (Cumulative Net Exports) of about 45 Gb (billion barrels).
I estimate that the 2005 to 2011 post-2005 Saudi CNE depletion rate was about 8.0%/year, with estimated remaining post-2005 CNE of about 28 Gb.
These estimates are, needless to say, somewhat at odds with conventional wisdom regarding Saudi reserves and net exports.
The following chart, Figure 14, shows Saudi Arabia’s ECI ratio from 2002 to 2011, extrapolated out to 2030 based on the 2005 to 2011 rate of decline in their ECI ratio:
http://aspousa.org/wp-content/uploads/2013/02/Slide14.jpg
*ECI ratio = Ratio of total petroleum liquids production to liquids consumption
Probably my favorite look at Saudi predictions was the 2005 New York Times article “The Breaking Point” – http://www.nytimes.com/2005/08/21/magazine/21OIL.html?pagewanted=all&_r=1&
In the article, Saudi oil minister, Ali al-Naimi (in 2005) told an audience that Saudi Arabia was embarked on a crash program to raise capacity to 12.5 mbpd by 2009 and this gem: “‘I can assure you that we haven’t peaked,” he responded. ”If we peaked, we would not be going to 12.5 and we would not be visualizing a 15-million-barrel-per-day production capacity. . . . We can maintain 12.5 or 15 million for the next 30 to 50 years.”
As Figure 7 above shows – that clearly didn’t work out.
Re: Iraq to the Rescue
Based on BP + EIA data, Iraq’s average rate of increase in net exports from 2008 to 2011 was 45,000 bpd per year, to 2.0 mbpd in 2011. I estimate that their net exports in 2012 were around 2.1 mbpd.
Even though Iraq’s net exports increased slightly from 2008 to 2011, their ECI Ratio fell from 4.15 in 2008 to 3.42 in 2011, a -6.4%/year rate of change, because the rapid increase in the rate of consumption exceeded the rate of increase in production. At this rate of decline in the ECI ratio, Iraq would approach an ECI ratio of 1.0, and thus zero net exports, around 2031.
In a similar fashion, ANE were up from 2002 to 2005, and then declined, but the GNE/CNI ratio fell from 2002 on (because the rate of increase in CNI exceeded the rate of increase in GNE from 2002 to 2005). In other words, the falling GNE/CNI ratio from 2002 to 2005 was forecasting future problems with the ANE supply.
GNE/CNI:
http://i1095.photobucket.com/albums/i475/westexas/Slide6-2_zpsce056b88.jpg
ANE:
http://i1095.photobucket.com/albums/i475/westexas/Slide3-5_zps99b2cedd.jpg
Definitions:
GNE = Global Net Exports, the top 33 net exporters in 2005, BP + EIA data, total petroleum liquids
CNI = Chindia’s (China + India’s) Net Imports
ANE = GNE less CNI
ECI Ratio = Ratio of total petroleum liquids production to liquids consumption
Professor,
Why do you narrow your data input? Technology has reduced demand in the US significantly. But monetary deflation and inflation as indicated by the price of gold may be the closest correlation.
Your graph of the Real Price of WTI is very instructive. Notice that the peak of oil price in the late 1970s early 1980s tracks with the huge jump in the price of gold. Then there was a significant decline in the price of oil as the price of gold fell due to the monetary contraction of Volker and then Greenspan. In the late 1980s Texas had an oil recession. (see Changing Texas Economy:Dynamics of the Free Market by Brown, Yücel, and Taylor Dallas FED December 10, 1998)
Then notice another sudden dip in the price in the late 1990s when once again the price of gold signaled deflation. The Texas oil infrastructure was devastated and could not produce to keep up with the increased demand of 2000. There was another Texas oil recession in the late 1990s.
There is much more impacting the price of WTI and the supply of oil.
Steven Kopits,
Great response once again.
After decades of Little Chicken screaming “Peak Oil,” it should become obvious and apparent to nearly everyone that the supply part is determined less by discovery and technology and more by regulation and taxes.
That said, the technology is readily available for natural gas powered vehicles to lighten the demand on gasoline. The NG distribution network is mature and reliable. Only the retail distribution points need to be set up and that can be done very quickly. Once again, it is not discovery or technology that is the issue; it is regulation [EPA] and taxation.
Karl Smith put this as moving from a boom and bust production style to a steady incremental demand style, one where real oil prices will stay more or less steady. This should support more stable growth and the transition away from oil, not a return to abundant oil and low prices. That extends the peak into a plateau, but doesn’t end it, and the real story is in the transition away from it.
Peak oil is a red herring. The real issue is peak CHEAP oil. It doesn’t matter that oil comes on the market when its at a price that is too high for us to keep using it the way we’re used to. Oil that is drawn on the market BY high oil prices, such as shale oil and deep sea oil, can not bring DOWN oil prices. This is elementary logic.
Oil prices remain sharply elevated WHILE the OECD is undergoing an unprecedented growth rate slump. Why isn’t the demand vaccuum suppressing oil prices? Where would the price have been if these crises hadn’t been going on?
This of course in addition to the fact that economic crisis was an implicit prediction of the peak oil thesis.
Daniel Yergin has been making the prediction that the price of oil would return to 20-30$ throughout the run-up in oil prices of the last decade. In that respect he as been as wrong as the worst of the peak oil doomers.
What happened was that the Hubbert curve is implicitly based on an assumption of constant price (details below), which was close enough to the truth up to about 2004 for the model to work. If the price of oil were still $25 per barrel, we’d be seeing peak oil in spades. What’s happened is that the price of oil has increased, making more oil worth drilling. Essentially, the production of oil now requires an ever-increasing price (over the long term) just to stay constant. Eventually, of course, the price will get high enough to crush demand and we’ll see true peak oil.
How fast the price must go up and how high it will get before we switch away from oil are difficult questions and I’ve not seen any serious data-based effort to determine them. Traditional peak oil theory is useless for predicting the future; it pretty accurately predicted when we exited the old regime of increasing production under roughly stable prices but it no longer applies.
The Hubbert curve predicting peak oil follows naturally from a predator-prey model where the prey can’t reproduce (http://www.theoildrum.com/node/5731). This would correspond to a real-world situation where drilling is done by capital-limited companies and where the usability of any given potential well never changes. More or less this means drillers don’t learn and bankers and other financiers are completely useless for any predictions about drilling or exploration. The fact that a model with such strong implicit assumptions does so well explaining what happened is kind of interesting in itself. Basically, it’s a model for the “immature” phase where use of oil is expanding to the optimization of short-term profits.
The model fails, of course, if there are reliable long-term changes in the price of oil. Higher prices mean more wells are profitable, so it’s like prey has been added to the model. The big question is the available oil-vs-price curve. Recent event don’t give us good numbers because there is a huge lag time (5 to 10 years) between a potential well becoming profitable and it actually getting drilled. The Bakken, for example, is still in the exponential growth phase of the predator-prey model. Over the next few years we should see the price of oil settle down to a steady increase and that will allow real prediction of the duration of this “mature” phase of widespread oil use.
Steven
Well, finally, a decent post.
Thank goodness that we “finally” have a topic that interests you. The rest of us, who apparently have a broader set of interests than you, won’t have to suffer through another one of your off-topic posts.
Repeat after me…”I am not the representative agent, I am not the representative agent,…”.
I enjoy your posts on the oil sector, but please stop whining about the choice of topics when the topic doesn’t suit your preferences.
Rob Wile is the best! I read everything by him. Awesome that you quoted him!
Robert,
you did notice that Professor Hamilton didn’t think he (Rob Wile) knew what he was talking about.
The only thing I’d pick as wrong in this is that you haven’t considered the relative decline on the US dollar in terms of pricing, for example vs the AUD the USD is nearly half the value it was from around the mid 2000’s.
Peak Oil Debunked
http://peakoildebunked.blogspot.ru/
Whether agreed with or not, got it right last time around while both Krugman and Hamilton did not…there are reasons people look away from what is properly neoclassic econ.
Would have been nice to see some consumption graphs along side the production graphs to complete the story.
US consumption of oil/gas
World consumption
Emerging markets consumption
Sloppy labeling tends to produce sloppy thinking. The success of Hubbert’s prediction has meant fame for the term he used. As sure as night follows day, fame for a technical term means the technical term becomes overused (if I never hear another “pushing the envelope” or “ahead of the curve”, it will be too soon) and serves as fodder for weak arguments.
“Peak oil” predictions assume fixed technology. Like many assumptions in forecasting, this one is required to make calculations tractable. It is not necessarily a claim that technology is fixed. If an individual declares the assumption of fixed technology to be accurate in the real world, then that individual is vulnerable to being proven wrong. If the assumption is made in order to predict oil field production, knowing that technological change (or price change) will change the result, that’s doesn’t mean the concept of “peak oil” is wrong. In this case, it just means that those arguing against peak oil either don’t understand what they are talking about, or don’t care that they are being sloppy.
Based on recent data, US crude + condensate (C+C) production is about 7.1 mbpd and C+C refinery inputs are about 14.6 mbpd. In round numbers, we would have to double US C+C production in order to have approximately zero net crude oil imports.
But given the recurring “Peak Oil is Dead” theme in the media, the current discussion is about when, not if, that the US becomes a net oil exporter. Following is a link to, and excerpt from, an item in the Fort Worth, Texas paper:
Energy executive predicts U.S. will export crude oil
http://www.star-telegram.com/2013/04/03/4748346/energy-executive-predicts-us-will.html
The EUR for the current production on Alaska’s North Slope are about 21 Gb (billion barrels). Prudhoe Bay accounts for the majority of the reserves, see link to graph up the thread. In order to double US C+C production, we would need the equivalent of about four North Slopes (and over 80 GB in proven reserves), and of course, contrary to conventional wisdom, depletion marches on, requiring us to continue finding more North Slope equivalents. Also, we would have to offset the declines from existing wellbores.
Unfortunately, the fractured tight/shale plays in the Lower 48 have much higher decline rates that what we see in plays like the North Slope. In my opinion, a reasonable expectation is that at least 90% of currently producing shale oil wells will be plugged and abandoned or down to 10 bpd or less in 10 years.
Peak oil isn’t just about what resources exist in what form. It’s also about what can be produced at prevailing prices. We can produce tight oil and tar-sands as long as prices are consistently above $100 a barrel. Regulatory forbearance is important here too—the costs of habitat recovery and groundwater remediation are going to run in the tens of billions. Right now those costs are being externalized on the basis that they are “unknown”.
At prices consistently over $150, keragen can be produced from oil shale in the Green River formation. There’s more hydrocarbons there than in the whole of Arabia. But you’ve basically got to strip out the tributary areas of the Green and Colorado rivers, putting tens of thousands of farmers out of business and possibly making the water for 40 million people undrinkable. I don’t think those environmental impacts can be externalized for long.
The upside is that oil prices over $100 a barrel make biofuels from algae and agricultural waste profitable, so maybe we can flatten out the extraction curve over the next 15 to 20 years.
So I would argue that yes, we’ve seen peak oil, and right now we’re converting less economical stuff to cope with it. Real oil prices will continue to climb at 3 to 5% per year, and much more once the public wises up to the environmental costs.
tj –
I am to be held to the gold standard, eh?
I have no problems with posts about MF or Wisconsin (but what about North Carolina, or California–these states are regularly anomalies in the national data). However, four posts in a week when Cyprus was melting down? When the North Koreans appear to have completely lost their minds?
If we had had a guest post from Gary Gorton on Eurogroup policy and the prospects for Europe-wide bankruns, or some similar topic, I would have thought it a splendid week for Econbrowser. If Menzie had thrown out a link to Susan Patton’s letter to the women on Princeton, all would have been fine.
But there was, from my perspective, the appearance of a lack of focus on the blog. Now, I understand that a blog can be an unforgiving task master (as can your commenters!). But the appropriate response to that is to share the load–link rather than write, or get a guest-poster, or add another regular poster to the roster–rather than posting less. If you post less, then you’ll find yourself losing readers, and that can unravel a blog over time.
That’s the point I was trying to make.
Something else that could have been linked last week. Uncle George’s piece in the WSJ:
Constitutional Mob Rule in Hungary
By GEORGE KOPITS
A number of recent constitutional amendments by Hungary’s Parliament have received well-deserved criticism from foreign governments and the European Union. Particularly troubling is the amendment granting practically unlimited power to Parliament to overturn decisions of the constitutional court, including retroactively.
With these changes in hand, and commanding a disciplined two-thirds majority in Parliament, Prime Minister Viktor Orban is now capable of exercising constitutional mob rule. By the definition attributed to Thomas Jefferson, this is government by which a majority may take away the rights of the rest of the population.
These developments would be worrisome enough on their own. But the international community has paid far less attention to the creeping centralization of economic policy under Mr. Orban. The recent appointment of Gyorgy Matolcsy as central bank governor is the culmination of Mr. Orban’s relentless campaign to extinguish checks and balances—a campaign that began nearly three years ago with the passage of an amendment curtailing the constitutional court’s jurisdiction over cases involving budgetary and tax measures.
Mr. Matolcsy was previously Mr. Orban’s economy minister and architect of the government’s self-described “unorthodox” policies. He has pledged to closely cooperate with the government, as underscored by the recent creation of a position, within the bank, of director in charge of “fiscal cooperation.”
A radical reorganization is also occurring at lower levels of the Hungarian central bank. Senior officials with proven professional qualifications—among them the former director for research, an internationally reputed young economist with a Ph.D. from the Massachusetts Institute of Technology—have been sacked.
And the central bank is hardly the exception. The presidency, the state audit office, the fiscal council, the central bank and the competition office are all now headed by Fidesz party loyalists with little, if any, relevant professional experience. The staffs of these institutions have been abolished or decimated. Ostensibly independent and de jure in line with EU statutes, these institutions—built and nurtured painstakingly since the post-communist transition—are being turned into de facto government implements.
The most visible effects have been in fiscal policy, which the Orban government conducts with a two-pronged goal. The first is to limit the budget deficit to the 3% of GDP required by EU law. This is accomplished via high and distortionary taxes, levied mostly on foreign-owned banks and energy companies, and on proceeds from nationalized pension funds.
The other goal of fiscal policy is to preserve generous entitlement programs for key constituencies. In a recent move along these lines, largely foreign-owned power companies have been ordered to reduce tariffs by 10%. This “goulash populism” is becoming increasingly intense, as the government seeks to recover from a significant slide in opinion polls ahead of general elections scheduled for next year.
Can anything keep Hungary from its path of democratic and economic erosion? Financial markets have not punished Hungary unbearably so far. Hungary’s stagnant economy and high public debt mean that Budapest pays a high risk premium on its junk-rated sovereign bonds. It lacks the supply of natural resources that has served as an economic cushion for populist governments in Venezuela and Argentina.
But EU membership and the Hungarian central bank’s foreign-exchange reserves have so far helped fend off a sudden stop in capital inflows. The Orban government also benefits from the widespread appeal of high-yield junk bonds, both corporate and sovereign, in today’s low-interest rate environment.
The EU has also been reluctant to penalize Hungary for Mr. Orban’s excesses. But the institutional erosion in Budapest clearly violates the spirit, if not the letter, of fundamental European values and statutes. Today’s Hungary is eerily reminiscent of the communist regime of Janos Kadar, under which all public institutions were potemkin bodies that dared not challenge the hegemony of the Politburo.
The time has come for European authorities to consider taking action, with a view to enforcing good practices for the welfare of Hungarians, and to deterring governments in other EU states from following Mr. Orban’s example. Otherwise, the EU leadership, along with financial markets, will be seen as the enablers of a destructive trend that will lead to regrets.
Mr. Kopits is a senior scholar at the Woodrow Wilson International Center for Scholars. He served as the first chair of Hungary’s fiscal council, from 2009 to 2011, and as a member of the monetary council of the Hungarian central bank from 2004 to 2009.
There is a sense in which Yergin has been winning the debate. Some in the peak oil debate are technicians. But others bring a quasi-religious apocalytical energy to peak oil, seeing it (sometimes with a sense of glee) as the end of civilization. For an example of that kind of pseudo-thinking, you might want to check out Thom Hartmann’s “The Last Hours of Ancient Sunlight.”
Yergin did us a favor by pushing back on those people, even if he was too optimistic on prices.
You can’t credit Yergin for pushing back on the peak oil apocalypse types. If anything, his ludicrous predictions give them support for their claim the non-peak-oilers are nuts. The pushback against the nuttier strains of peak oil is the reality that higher prices have made more oil available. They would actually look even more ridiculous if Yergin hadn’t been spouting nonsense in the other direction.
Obviously, a finite world cannot support exponential increases in crude oil production into infinity, nor can oil continue to be pumped indefinitely without depleting. Where the peak oil theorists went wrong, however, was in assuming that the typical experience of individual wells and even entire oil fields could be simply extrapolated upwards to the entire planet. It is much more complicated than that, not least because at the global level political and well as economic factors start coming into play.
Stefan,
That’s the whole point isn’t it? Discrete oil wells peak and decline, discrete oil fields peak and decline, and discrete regions, e.g., the North Slope graph linked above, peak and decline, but something magical happens when we sum the output of these discrete sources that peak and decline.
According to the Cornucopians, the sum of the output of discrete regions that peak and decline will either: (1) Never peak and decline or (2) The peak is so far away that by the time it happens we will have Mr. Fusion devices on our cars.
Meanwhile, back here on Planet Earth, the fact remains that developed net oil importing countries like the US are gradually being shut out of the global market for exported oil, as developing countries, led by China, consume an increasing share of a declining volume of Global Net Exports of oil (GNE). And so far, the rate of decline in the ratio of GNE to Chindia’s Net Imports (CNI) has accelerated (through 2011, 2012 data not yet available).
To use another analogue, the accelerating rate of decline in the GNE/CNI ratio is analogous to a commercial airliner in an ever steepening dive, headed toward a non-survivable crash, as the passengers talk about dinner plans, oblivious to the ever steepening dive.
GNE/CNI:
http://i1095.photobucket.com/albums/i475/westexas/Slide6-2_zpsce056b88.jpg
ANE:
http://i1095.photobucket.com/albums/i475/westexas/Slide3-5_zps99b2cedd.jpg
Definitions:
GNE = Global Net Exports, the top 33 net exporters in 2005, BP + EIA data, total petroleum liquids
CNI = Chindia’s (China + India’s) Net Imports
ANE = GNE less CNI
ECI Ratio = Ratio of total petroleum liquids production to liquids consumption
A very good piece. But though I’m on your side, I think it’s unfair to use Boone, a businessman not a “peak oil” writer, against Yergin. Simmons vs Yergin would have been more fair.
The story so far has turned out to be neither what Simmons nor Yergin predicted. What we’ve had is more like “plateau oil”, with basically flat volumes and rising average production costs. That seems most likely to continue for the next decade or three. It still looks like we are heading for a drop from the plateau when the fracking fields deplete. Perhaps then it will be arctic oil.
As Matt Simmons pointed out (Twilight in the Desert) taking Saudi production at face value does not factor in the “water cut”, i.e., the percent of water in every barrel of oil pumped.
Those who dismiss the fact of limited natural resources on earth (including the the energy needed to transform them into usable goods) and the ability of the global ecosystem to absorb CO2 must have an otherworldly view of the physical world.
http://www.dailystar.com.lb/News/Health/2012/Dec-06/197471-global-food-production-to-slow-following-boom-un-report.ashx#axzz2PWCsQfW6
http://www.un.org/en/globalissues/food/
http://www.fao.org/worldfoodsituation/wfs-home/foodpricesindex/en/
http://www.fao.org/worldfoodsituation/wfs-home/csdb/en/
http://wsm.wsu.edu/researcher/WSMaug11_billions.pdf
Food prices since 2000 are rising at a 7% rate, accelerating to ~9% since Peak Oil in 2005. Cereals prices are rising at 9%, accelerating to 12-13% since 2005.
http://www.fao.org/worldfoodsituation/wfs-home/csdb/en/
Despite the increase in cereals and wheat prices at a doubling time of 5-8 years, production of same is down 4-7% per capita since 2008.
http://data.worldbank.org/indicator/NE.CON.PETC.ZS
http://www.eia.gov/dnav/pet/hist/LeafHandler.ashx?n=PET&s=RBRTE&f=D
The share of the world with the fastest growth of population tends to be the areas with the highest pct. of income spent on food, i.e., 30-50%. Given the share of income spent on food and consumer spending to GDP, to sustain purchasing power vs. the increase in food and energy prices, incomes in the developing world must rise at least 4-5%/year, which implies sustained growth of GDP of a minimum of 6-7% for the more developed countries, such as China and India, and faster for less developed areas.
Does anyone actually expect the developing world to continue to grow at a doubling time of 5-10 years to keep up with the increase in energy and food prices?
By definition, persistently high oil/liquid fuels and food prices will constrain growth of one-third of world real GDP per capita in which the fastest growth has occurred since the 1980s-90s.
Given our tendency to be US-centric, if you will, we tend not to examine the larger global macroeconomic conditions nor the areas of the world that are the weak links in the global distribution chain, so to speak. That the global economy is now nearly fully integrated and there is GDP parity between the three major trading blocs, China-Asia/MENA/sub-Sahara Africa is now increasingly vulnerable to energy and food supply and price shocks, which in turn makes North America and the EU vulnerable to diminishing returns to FDI in China-Asia to support continuing growth of the global production system, supply chain, and mass-consumer economy.
This is the larger global structural implication of Peak Oil and by extension peak public and private debt and peak real GDP per capita.
While I have heard many arguments in favor of Peak Oil predictions, I have yet to hear a concrete explanation for why this is something of concern to anyone outside of the Petro industries or the State Dept.
Oil prices may have doubled in the last 6-7 years, but there hasn’t been any reports of supply disruption, nothing in the economic data suggest a causal link between production levels and world economic output, and consumers seem to be actually thinking about efficiency.
Assuming the markets continue to work in an orderly fashion, is there some point where these predictions will actually matter?
JH:
The only “measure” of peak oil is NOT total production.. there’s always another oil patch somewhere further underground.
It’s EROEI: energy returned over energy in.
Think about it: In 1900, if you put a large straw in the ground in Texas, you struck oil. The EROEI was nearly infinite. Now, the only place you’re finding oil is at 5000 feet under the ocean or in the tar sands.. where you have to spend 3 barrels of oil performing the extraction to generate 4 barrels of oil. It’s not the raw number, it’s the delta between what you get minus what you put in to generate that output.
Oil prices may have doubled in the last 6-7 years, but there hasn’t been any reports of supply disruption, nothing in the economic data suggest a causal link between production levels and world economic output, and consumers seem to be actually thinking about efficiency.
You must not be a regular reader here, MyName, because you’re well off the efficient frontier for an Econbrowser commenter.
Here’s the deal: With the oil supply unable to keep up with demand growth, oil consumption has been reallocated from the OECD countries (the advanced economies) to the non-OECD economies (China et al).
Indeed, for the first time, in the three months through Feb. 2013 compared to the same period a year earlier, 100% of incremental emerging economy consumption was provided by the advanced economies. China is drilling for all its incremental consumption on Main Street USA. (Now think about when peak oil might occur using that framework.)
Do the math, and you can calculate that US consumption will decline at a 1.5% pace per annum. (I’d note that when I presented to the assembled EIA analyst team a couple of months ago, this number came out at -2.1%, and for the Feb to Feb period, the actual was -2.2%.)
But does this matter? Well, that depends. If efficiency gains can increase by more than a desired GDP growth rate, say 3%, plus the decline in consumption, say 2% for the moment, then declining oil consumption doesn’t matter. Put another way, this implies oil consumption efficiency in GDP can increase by 5% per annum. This is, implicitly, BP’s thesis currently.
I asked Maria van der Hoeven, Executive Director of the IEA, whether she thought a sustained 4.5% efficiency gain was possible, and she answered flatly: “No.”
Jim has back-of-the-envelope calculated this number at 2.5%. Recently, oil efficiency per unit of US GDP has been increasing by 3.8%. My sense is that, at least in an expanding economy, it could be 3.3-3.6% for some period. But I rarely estimate these numbers better than Jim, and he has an almost uncanny ability to suggest a number casually that proves quite durable.
Now, if oil efficiency can’t improve at a 4.5-5.0% pace year in, year out, then the US economy cannot grow at a 3% pace either. And guess what, that exactly conforms to the data! The US has been unable to grow at 3%. And no one knows why. The CBO, the Fed and all the macro guys are baffled as to why the recovery has been so poor. Well, presto! Oil’s the explanation, and the max rate of change of oil efficiency is the analytical linkage.
In any event, that’s why just about all the OECD economies are in recession, and none of the non-OECD economies. The oil donors–the OECD–are struggling to adjust to the oil consumption they are ceding to the non-OECD countries.
To a retired power plant engineer, this was a most informative colloquy. My thanks to all. However the peak oil theory is irrelevant. As noted, it does not matter how much is down there, but how much does it cost to get the next barrel up here, and can we sell it at a profit? The unaddressed elephant in the room is the much touted carbon combustion externality cost, the cost external to the contract price, which is paid by society, e.g. pollution. My guesstimate is that it ranges from a penny per barrel to $1,000/ barrel. The basis of this cost is religious in nature, i.e. the cost of bad behavior (carbon combustion) will be defined in a far distant disaster, global hell. The value is nebulous and massive; it is the raison d’être for the 18,000 employee EPA. At a penny, they are worthless; at a $1,000 you are worthless. Both claim to be vital for continued human survival, both for the US and the world. It would be nice to know.
Until then, I advise all bright young teens to avoid all energy engineering. Your livelihood may well be wholly destroyed mid career, by some new regulation. I lived this in nuclear power and coal fired power plants. And the word is out. If you follow engineering enrollments, you see that peak engineering talent, not fuel, is America’s emerging crisis. Currently we import talent but that is changing to outflow, engineers are leaving the US. Our climate change-scientific-political-social cost decision tin can is stuck; we can no longer kick it down the road. Peak oil is not the problem.
Steven Kopits wrote:
“I asked Maria van der Hoeven, Executive Director of the IEA, whether she thought a sustained 4.5% efficiency gain was possible, and she answered flatly: “No.””
We could easily achieve that by switching off of oil. Solar panels require fairly small oil investments and produce enormous energy returns over their lifetime.
We are seriously underinvesting in doing that.
There were 3,313 megawatts (MW) of photovoltaic (PV) capacity installed in the US last year, which represents 76% growth over 2011’s record deployment totals.
PV solar has capacity factors around 20%.
Thus, incremental solar capacity last year added 6 million MWhs (6 tWh).
US oil consumption is declining by about 350,000 bpd / year, equal to 219 million MWhs (219 tWh).
Solar additions were able to offset about 3% of the decline in oil consumption.
Solar remains heavily subsidized, as do electric cars. Even with subsidies, all electric (BEV) vehicle sales will probably not exceed 50,000 this year, on a base of 15 million (0.3%). And that’s with subsidies.
Hard to see how solar gets you there at any reasonable cost or time frame.
High costs, due to inherent technical limitations, will constrain all green energies for bulk supply. No society can sustain the costs of this life supporting commodity; it is similar to food and water. (There will be niche markets for each technology but not for propulsion.) Propulsion energy requires low cost, high energy density (mass and volume) portable fuels. Only hydrocarbons meet this need. This is expected to remain a basis for the foreseeable future.
Whoever contradicts this statement, by investing, will be able to buy, or sell Bill Gates with his pocket change.
But no one should invest their entire career in this risky political conflict (see my post above.)
“Thus, incremental solar capacity last year added 6 million MWhs (6 tWh).
US oil consumption is declining by about 350,000 bpd / year, equal to 219 million MWhs (219 tWh).”
In your view, the way solar works is by being burned up like oil is to produce energy?
Perhaps you think that farmers historically operated by mining the dirt every year to grow food because one year of crops just burns up the soil and nothing at all can be grown and harvested again.
To compare solar capital investment you must compare the oil well capital investment, their useful lives over which the capital is depreciated and recovered in production sales, plus the operating expense per unit of output.
Solar capital is often depreciated over 7 years with useful life of 30 years, and low operating costs, while oil capital is depreciated over 1-3 years with useful life of 5 to 10 years, and high operating costs. But the second factor is the land – after 30 years, the solar capital can be scraped and new solar capital built to replace it, but the land for oil is played out after the original capital is scraped and will not ever be useful for oil production again.
Solar panels do not have a positive return on investment. Without a subsidy, no one would buy them.
I agree with Jeffrey Brown’s analysis. The explosion in price has not led to an increase in light crude. I would say that puts the analysts who used Hubbert Linearization to predict a peak during the 2005-2014 period closer to the truth than Daniel Yergin or the optimists who keep muddying the waters by bringing up NGLs, biodiesel, ethanol, or refinery gains as proof that there is no problem. The simple fact is that the high prices of energy and the continual printing of currencies have caused the real economy to weaken and demand to decline. While there is new production from low quality sources like shale the SEC filings show that it is mostly unprofitable as the high estimates or ultimate returns run into the reality of much higher than supposed decline rates that forces producers to close their funding gaps by adding massive amounts of debt to the balance sheets, diluting existing shareholders, or selling off assets.
It looks to me as if the economists got another thing wrong and missed the fact that the narrative does not reflect the underlying reality.
Steven Kopits makes some valuable points, but I think you have to be careful not to confuse the different possible meanings of oil efficiency.
If the measurement is simply GDP per barrel consumed, then that can be increased by using other energy sources such as natural gas, or by disproportionate growth of the parts of the economy that are least energy-intensive. This is the kind of “oil efficiency” gain that has to be sustained at 4.5% annually to achieve sustained 3% annual growth and 1.5% annual reductions of fuel use.
When the IEA analyst said she didn’t believe sustained 4.5% efficiency gains were possible, she might have had in mind a different concept of oil efficiency defined according to specific activities that oil powers – eg, can the automotive industry sustain 4.5% annual MPG improvements, no it obviously can’t, can oil-powered heating heat 4.5% more space per barrel every year forever, not it can’t.
I’m not so sure that America’s oil consumption cuts have come at the cost of GDP. Driving an SUV to work vs a compact does not so far as I can tell generate more GDP.
One cherry picked prediction of $60 oil is a poor basis for an argument.
On the day of the peak in oil prices Matt Simmons was interviewed on CNBC predicting $200 oil by the end of 2008. Over the following months prices fell by over 70%.
The fact is that the industry has not only kept up with growing demand but also replaced locked in supply blocked by US sanctions or war-making.
Here’s a link to an economist’s take on the question:
http://alethonews.wordpress.com/2009/12/03/the-recurring-myth-of-peak-oil/
Tom –
Some quick points:
Adapting to reduced oil consumption can be decomposed into a series of factors:
– efficiency (same exact car, just uses less fuel)
– conservation I (a smaller car, but you still go to the store)
– conservation II (fewer trips to the store)
– social reorganization (face time versus showing up in person)
– reduced economic activity
We have good data on some of these categories, little on others. The numbers I refer to are aggregate, that is, covering all these areas.
Does oil consumption matter? Here’s a nice chart from Doug Short. http://advisorperspectives.com/dshort/charts/indicators/miles-driven.html?miles-driven-CNP16OV-adjusted.gif Another one of those where you can clearly see peak oil. Can a society like the US prosper when it is losing mobility? Probably not.
You are correct to point out that nat gas should be brought on aggressively as a transportation fuel. That’s where the analysis takes you.
Finally, Maria van der Hoeven is not an IEA analyst. She is the head of the organization.
Mr. Kopits’ insight on solar energy costs is absolutely correct. But we read this concept so often that it may be worth discussion. This article is about bulk supply energy market costs, and Steve is spot on. However, in the electricity market, there are two cost structures, for guaranteed constant supply (as defined) and interruptable supply, a lesser valued commodity. Some buyers want cheap; they do not care if occasionally power is lost e.g. pumping water into a tank. In remote locations, where bringing the grid supply to the load is costly, solar supply has value. But this market is tiny, and solar’s higher cost, due to inherent technical characteristics (no sunshine at night) is acceptable.
Green ideologues screw this up continually. Baring another Eisenstein, a massive unknown scientific break through, solar will only be marginally useful for bulk energy supply, perhaps for the next century. Societies which rely on it, are now and will experience epic suffering. No savvy investor will risk private money on this deal. Green energy is a rigged deal.
Somebody has to listen to engineers. (I engineered a score of nukes, two score fossil power plants, and spent decades assessing advanced technologies)
Re: aletho
A Tale of Two Price Doublings
In my opinion, average annual oil prices give us a much better indication of fundamental supply & demand factors than do daily or monthly prices, and since 2002, we have seen two annual doublings in Brent annual crude prices, from $25 in 2002 to $55 in 2005 and then from $55 in 2005 to $111 or more in 2011 and 2012. We did see one year over year decline, down to $62 in 2009.
So, in response to the usual qualitative assertions, in effect, that there is no problem with a virtually infinite rate of increase in our consumption of a finite fossil fuel resource base, I usually like to respond with a quantitative data.
We saw a robust across the board increase in all measures of global liquids production in response to the first price doubling, from 2002 to 2005.
However, the response to the second price doubling, from 2005 to 2011, was far different, ranging from a small increase for total liquids production, to virtually flat crude + condensate production (and probably flat to declining global crude production) to material declines in Global Net Exports of oil (GNE*) and in Available Net Exports (ANE, or GNE less Chindia’s Net Imports, or CNI).
The initial charts in the following paper show the gaps between where we would have been at the 2002 to 2005 rates of increase in production and net exports versus where we actually ended up in 2011 (2012 data not yet available):
http://www.resilience.org/stories/2013-02-18/commentary-the-export-capacity-index
As I (and Steven Kopits) have outlined above, the dominant trend we are seeing is that developed net oil importing countries like the US are gradually being shut out of the global market for exported oil, as the developing countries, led by China, consume an increasing share of a declining post-2005 volume of GNE.
While I don’t think that the Chindia region will actually consume 100% of GNE at some point in the future, the fact remains that the rate of decline in the GNE/CNI ratio has accelerated in recent years, so we are currently headed, at an accelerating rate of decline, toward an economically non-survivable point of impact.
As noted above, I think that this is analogous to a pilot pushing the stick forward, putting a plane into an ever steepening dive, while virtually all the passengers are totally oblivious to what is happening, discussing dinner plans for that night.
GNE/CNI:
http://i1095.photobucket.com/albums/i475/westexas/Slide6-2_zpsce056b88.jpg
ANE:
http://i1095.photobucket.com/albums/i475/westexas/Slide3-5_zps99b2cedd.jpg
Definitions:
*GNE = Global Net Exports, the top 33 net exporters in 2005, BP + EIA data, total petroleum liquids
CNI = Chindia’s (China + India’s) Net Imports
ANE = GNE less CNI
ECI Ratio = Ratio of total petroleum liquids production to liquids consumption
Aletho –
Matt’s predictions prompted me to write “Oil: What Price can America Afford?” (http://www.epmag.com/Production-Drilling/Oil-price-America-afford_41209)
It wasn’t clear to me at the time that the US could actually afford $200 oil without reducing consumption. As the article shows, the US will reduce oil consumption when spend on crude oil exceeds 4% or so of GDP. Today, that number corresponds to $95-100 / barrel Brent, and US oil consumption has indeed been dutifully falling as the Brent price has exceeded this level.
In short, my analysis refuted Matt’s assertion that oil could go to $200. Except in the context of a short term price spike (which could have been a demand spike pre-2008, but no more) or a supply disruption (still possible), oil prices will not rise to $200 anytime soon.
Peak oil theory seems to be winning, though not in a rout. There is enough coal for everyone, for a long time.
Would JDH, Kopits, or Jeffery J. Brown care to comment on the role of Japan’s increased net imports post-nuke in the current prices of oil and LNG and the approximate shock effect of that on the world economy?
Also, I concur that solar is not currently cost-competitive absent subsidy. This is not prima facie evidence that the long term social return is negative. Investment via subsidy in technological progress does not require a short-term return to have a positive long-term return (witness railroad land grants). I would question whether the existing subsidies are the most efficient available, of course. At the present time, government funded windpower would be cost competitive, fiscally positive, and economically stimulative in the U.S. That does nothing about liquid fuel supply constraints, of course.
(Natural) Gas price hints shale revolution fading:
http://www.ft.com/intl/cms/s/0/e03293c2-9e0f-11e2-bea1-00144feabdc0.html?ftcamp=published_links%2Frss%2Fmarkets%2Ffeed%2F%2Fproduct#axzz2PhuZaS5w
The professor’s Peak Oil paper is posted on The Oil Drum.
http://www.theoildrum.com/node/9928
benamery21
I respond with apologies; this topic, though vital, is off point to peak oil.
Government subsidies will always, like honey, attract flies. The key is whether they advance the general society, or simply insiders. The history of railroads in the nineteenth century is clear; American lived longer and gained weight. (I exclude native Americans, who lost big time.) The error in thinking about green energy is to wish unreality. These are mature technologies, which only have marginal advances. Example: My old boss got his Masters in Fuel Cells in 1954. He told me that over his entire career, fuel cells were predicted to become a killer app within five years. He is now deceased. Example: There are existing prototype power plants which ceased operations within the hour the subsidy ran out. Their sole raison d’etre was to exploit some give away. NEVER feed lobbyists Congressmen, or engineers, without demanding real world results.
Steve Kopits says: “Solar panels do not have a positive return on investment. Without a subsidy, no one would buy them.”
I have a bid on my desk for 4905 kwh of solar panels for my house. Cost before subsidies is $18K. These panels should reduce my electric cost by about $500/yr. 500/18K = about 2.8% which is a lot more than I can get from the bank. When subsidies are included the return jumps to about 8%. Also, these panels should keep producing for 25 years and the returns go up as the local cost of electricity escalates. The solar panels have a 25 year lifetime warranty.
I was shocked by the economics of this. I had always thought like Steve Kopits that solar panels were a bad investment, at least at the retail level.
Apparently the world has changed for both Steve Kopits and myself while we were not looking.
@KevinM
Peak oil theory seems to be winning, though not in a rout. There is enough coal for everyone, for a long time.
Peak oil has nothing to do with coal.
R.L. Hails — Although I believe many of the incentive and market structures employed recently for renewables have been less efficient than they might have been (witness the 100kW PV install on which my father’s customer was able to achieve one year payback in 2010 without even accounting for energy production, while producing 6 figure profits for my Dad), I think you would be rewarded by closer study of the changes in performance and cost of real world installations of both PV and solar over the past decade. While these technologies may be at conceptual technological maturity, they are not at industrial maturity and have progressed significantly and measurably over the last decade. I have had opportunity to see this firsthand, as the CA IOU for which I am a professional electrical engineer has been the site of both early pioneering efforts and substantial recent installation volume in both categories.
Anon2: Although I concur with you that the recent decrease in price for PV is remarkable (panel prices of 65 cents a watt are not unheard of in bulk), I’d like to point out some of the subsidies which apply beyond easily recognized utility rebates and income tax advantages.
In many cases the install will be exempt from sales and property taxes as well as permit fees. Often the utility will be prohibited from collecting the direct cost of upgrades necessary to the interconnection which will raise costs for other ratepayers. Also, most small grid-interactive PV installs are connected on some form of net metering tariff. This allows the install to use the grid as storage and backup supply while receiving direct credit at retail prices for production. This is arguably an excellent subsidy currently, since at low levels of PV installation it imposes small costs on other ratepayers while providing large benefits for PV owners, however, as PV penetration increases, the cost imposed on other ratepayers will rise disproportionately.
Kopits: you are slightly unfair to PV production in comparing its caloric value directly to petroleum, given that it is on average converted to useful work at a far higher efficiency rate. This does not change your point that PV production is currently close to trivial. This is beginning to be less true of renewables as a whole.
Van gel,
Coal is an obvious substitute in an oil shortage. Nuclear, wind and solar are inferior to gasified coal if the objective is a 12 hour drive from North Carolina to Florida.
Re solar, it is getting better, but it still takes 30 square miles of panels to replace one nuclear plant. You would need to depopulate and deforest an area larger than New York City to power New York City.
Rooftop panels are inefficient in a jagged skyline, fixed mount scenario.
Much more nuclear, panels on suburban rooftops, coal burning hybrid cars, and windmills as far as possible from where I live.
I don’t understand why the law of cause and effect isn’t understood.
The peek oil proponents are not really proponents at all. They are just observers that understand that whatever we take out of a hole will no longer be in the hole. Simple really.
The only shortcoming of the peek oil proponents(AKA oil-realists) is that they do not have access to raw data. So therefor they must resort to a projection based understanding using real historical models.
Hopefully we will be able to never have to come to the time in which the ORs get to say “I told you so”. Cause if that happens were all SCREWED.
I don’t think bio-fuels will always have major impacts on food. As the earth warms, water cycle efficiency improves, and CO2 concentrations grow GMO and nano-tech may become efficient fuel producers.
Recent increases in CO2 alone are estimated to have contributed 15% to bio-productivity (our food supply).
Re: Current Rebound in US Crude + Condensate (C+C) Production
US C+C production increased leading up to the 1970 peak of 9.6 mbpd, so by definition the production increase did not continue forever.
US C+C production rebounded to 9.0 mbpd in 1985 (primarily because of Alaskan North Slope production), after hitting a low in 1976 of 8.1 mbpd, so the rebound in production did not continue forever.
Since “The Peak Oil Theory is Dead,” the Cornunucopians seem to be arguing that this time, as US production has rebounded (primarily because of tight/shale plays) from a low of 5.0 mbpd in 2008, to 6.5 mbpd in 2012 (and to about 7.1 mbpd currently), the rebound in production will continue forever.
So, the argument is that this time–contrary to the prior case histories–things are different and we will have a virtually infinite rate of increase in our consumption of a finite fossil fuel resource base.
Another author who has no clue what he’s tnaiklg about. Yes, oil has peaked. Peak oil’ and oil depletion’ are two compeltely separate entities. Peak oil doesn’t mean that oil is running out . No peak oil theorist claims oil is running out, in fact quite the opposite.. peak oil theorists claim oil will NEVER run out.Why? Because oil takes energy to get. This is called EROEI energy returned on energy invested. People are pointing to oilsands and shale as evidence against peak oil when in fact it is the energy input to energy output of these new reserves which confirms peak oil.The oilsands have a piddly 3:1 EROEI ratio, compared to conventional oil which was around 200:1. That means that for every 3 barrels of oil coming out of the oilsands, it took 1 barrel of oil equivilent energy to get those 3 barrels. Peak oil theorists claim oil will never run out because for us to run out of oil we would eventually need to extract oil at a negative ratio. Eventually it will require 1 barrel of oil to get 1 barrel of oil at this point oil extraction will cease, not because there isn’t oil but because there is no economic incentive to get it. Peak oil is not oil depletion, and by the way.. stones didn’t fly airplanes or operate an industrial economy of which 7 billion people rely on. Apples and oranges bud.