From the MacIver Institute, “The Free Market Voice of Wisconsin”:
Secretary Reggie Newson, Department of Workforce Development, and John Koskinen, Chief Economist for the Department of Revenue, both gave testimony that Wisconsin is heading in the right direction.
This is in contrast to two years ago where Wisconsin had lost over 150,000 jobs, Newson explained. “Based on all the indicators we look at, the state is moving in the right direction. We are adding jobs here in the state of Wisconsin.”
. . .
Though Koskinen could not give an exact ranking based on the revised numbers, he explained the Wisconsin had some of the largest gains in the country over the previously reported numbers. The improvement in the revised data was better than all of Wisconsin’s neighboring states.
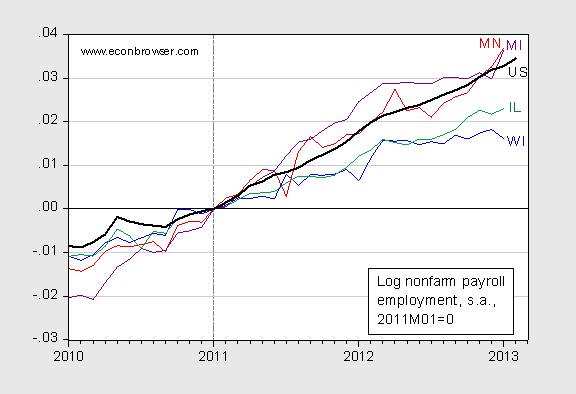
Interestingly, as I noted in an earlier post, Wisconsin’s employment growth – even after incorporating the large upward revisions – lagged far behind that of its neighbors.

Figure 1: Log nonfarm payroll employment for Wisconsin (blue), Minnesota (red), IL (green), Michigan (purple), and United States (black bold), normalized to 2011M01=0. Source: BLS, March 18 release, and author’s calculations.
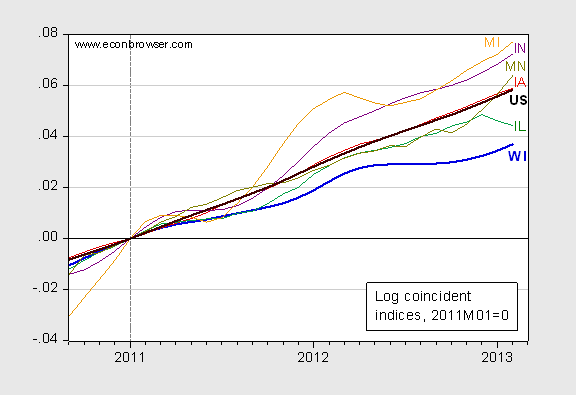
Newly released coincident indices from the Philadelphia Fed provide another perspective on Wisconsin’s relative performance:

Figure 2: Log coincident indices for WI (blue bold), IL (green), IN (purple), IA (red), MI (orange), MN (olive) and US (black bold), rescaled to 2011M01=0. Source: Philadelphia Fed (April 2 release), and author’s calculations.
Wisconsin economic activity lags all its neighbors, and slightly more than 2 percent cumulatively since 2011M01 vis a vis the US. Note that Wisconsin lags more than 2 percent against MN, (the state which Department of Revenue Chief Economist John Koskinen highlights in his powerpoint presentation [slide 10]).
Update, 4/4, 2:15PM Pacific: Discussion of the MacIver Institute, and other regional think tanks, here.
Menzie,
You are correct. Wisconsin has had such bad government in the past that it has a long way to go. The latest release of economic freedom in the states showed Wisconsin falling two places. But there was a footnote that in recent months the state has been turning the corner.
Thanksfully Wisconsin is not Illinois a state headed for destruction, neither is Wisconsin Texas, but it is headed in the right direction.
While the stats are still struggling I would think you would be cheering the policy changes.
Wisconsin taxes are stupid high. Illinois doubled their income taxes, and they’re still less than in Wisconsin.
Walker has a long way to go to make the state competitive with its neighbors. And it isn’t like the target is standing still either. Here in Indiana, our governor is trying to cut our already low income tax by 10%. He is meeting resistance in the legislature from REPUBLICANS who want to spend more on teachers (so much for stereotypes!).
Ricardo and Buzzcut: Can you people read graphs? Wisconsin was tracking US activity before 2011M01 (actually from trough, was growing faster — you can download the data from the Philadelphia Fed using the link provided and verify for yourself). The break appears sometime concurrent with or after 2011M01 (i.e., the beginning of the Walker Administration). How do your tax explanations and/or inherited problem arguments fit in with the data?
Back when this started, the point was that change in policies would deliver clear results. Now the point is a long argument that revisions to bad numbers look good.
Apparently, there are job numbers and then there are job numbers.
http://finance.yahoo.com/blogs/daily-ticker/labor-market-worse-shape-think-151625059.html
Menzie,
Do you really believe that Wisconsin is equavalent to the whole US? You do not believe there is a difference between California, Illinois, North Dakota, Texas, and an aggregate of them all? Keynes might be proud of your enslavement to aggregate analysis but people don’t live in the aggregate.
Also decisions made today do not necessarily become manifest tomorrow. Once again do not be enslaved to instant gratification. This kind of thinking comes from demand theory consumption policy economics. Capital and productive activities are not like going to K-Mart and buying a soda.
Ricardo, can you read graphs? How long is something supposed to take? This is 2 years hence. I know how to read trend lines and how to look at the rate of change (yes I know that’s calculus, but maybe you remember something about it). By any sort of math, WI isn’t keeping pace with either it’s neighbors or the US used as a baseline (whatever point your first paragraph is actually trying to make, I’m having difficulty parsing it for content).
Talk about word salad! Keep up the good work Ricardo, you’re making moderate conservatives like me run screaming into the arms of Democrats everywhere. Good job!
Menzie,
I’ve often wondered if starting points affect relative performance.
For example, Michigan’s “unemployment pot” was significantly greater [both absolute and percentage] than Wisconsin’s. Does that have any impact on the percent change in employment from period to period? My gut tells me it should, but then one can point to North Dakota where an oil boom is producing fairly significant percentage increases in employment with a very small “unemployment pot” … people are migrating to ND for the jobs. So, does that mean that ND’s governing policies and administration are far superior to either Michigan or Wisconsin? It certainly would then indicate far superior to most states.
It would seem only fair to praise ND’s government if we choose statistics that blame WI’s government for changes in employment, wouldn’t it? Maybe we should all be like ND.
Bruce Hall: That’s why I compare WI against her neighbors — the hope is at least some of them are structurally similar to each other (say WI and MN) so that at least some portion of the residual difference can be attributed to policies. For more data, see a handy interactive device for looking at cross-state data here.
You are right that to be complete, one would want to run a panel regression with growth (or some other measure) on the LHS and a series of control variables for structure of economy, etc., on the RHS, in addition to variables proxying for policies such as eliminating teacher positions, providing tax cuts, etc.
Lets say you have 100,000 people on the state government payroll. You give them all a 10% pay cut and stop borrowing the money you were using to pay that 10%. The citizens of the state become better off as the debt liability stops growing. However, in the short term the people that took a pay cut spend less immediately and economic activity slows even as wealth creation improves.
As the long term wealth grows the citizens are better off, but not without short term negative effects. The state of course could continue like Detroit until they can not borrow any more and are forced to reduce spending.
Not to say that is what happened here for sure as there are a number of variables. Similar to federal numbers when the current president is blamed for the current economy without regard to the world situation, the house and senate and another ten to twenty drivers.
The trend is in the right direction. This trend is because workers have the right to choose.
According a Labor Department filing made last week, membership at Wisconsin’s American Federation of State, County and Municipal Employees Council 40 — one of AFSCME’s four branches in the state — has gone from the 31,730 it reported in 2011, to 29,777 in 2012, to just 20,488 now. That’s a drop of more than 11,000 — about a third — in just two years. The council represents city and county employees outside of Milwaukee County and child care workers across Wisconsin.
Labor Department filings also show that Wisconsin’s AFSCME Council 48, which represents city and county workers in Milwaukee County, went from 9,043 members in 2011, to 6,046 in 2012, to just 3,498 now.
The Labor Department filings don’t paint of a complete picture of ASFCME in Wisconsin. It has two other branches in the state, Council 24 and Council 11, but they do not have to file these reports. According to a Labor Department spokesman, these federal disclosure requirements do not extend to unions that solely represent state and local government employees.
…Last year, the Wall Street Journal reported that statewide membership “fell to 28,745 in February from 62,818 in March 2011… Sean Higgins