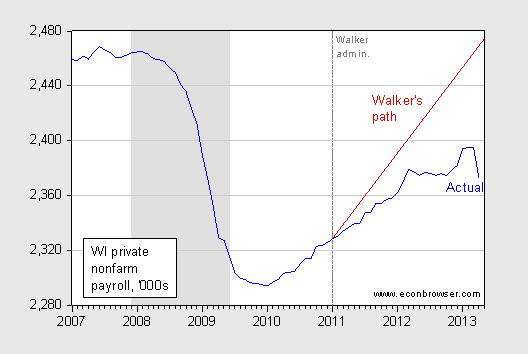
Newly released BLS data indicate an absence of strong employment growth.

Figure 1: Wisconsin private nonfarm payroll employment, seasonally adjusted (blue), Walker’s implied path for private employment (red). NBER defined recession dates shaded gray. Source: BLS and NBER.
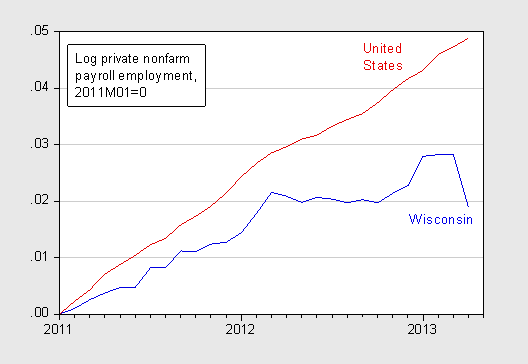
To place this outcome in context, I compare the change in Wisconsin private employment against the US.

Figure 2: Log Wisconsin private nonfarm payroll employment, seasonally adjusted (blue), and US (red), both normalized to 2011M01=0. Source: BLS, NBER and author’s calculations.
There has been some debate over the reliability of the BLS series — see this post. As noted there, BLS data has been benchmarked through December 2012. In any case, the most recent data for April should be viewed as preliminary.
Update, 8pm Pacific: Reader c thomson asserts the slowdown in Wisconsin employment growth relative to US could be entirely coincidence. To check this out, I start out with the null that WI and US nonfarm payroll employment growth rates are equal. Define the variable DEV = log(WI employment/US employment), and DUMMY is a binary variable taking on a value of 1 for 2011M01 onward. Then run a regression, 1990M01-2013M042013M01:
ΔDEVt = α + β DUMMYt
where Δ is the first difference operator.
With ΔDEV annualized, the coefficient is -0.007, with the HAC standard error of 0.0027. The t-statistic is -2.644, so one rejects the null hypothesis is rejected at the 1% msl using a two tailed test.
When the data is extended to 2013M04, the estimated β is -0.0108, t-statistic of -2.275. (Thanks to reader AS for pointing out my truncated sample in results reported earlier.)
How does WI compare with OH, IL and IN? Or SC and NC?
Measure the old industrial against the new, perhaps? Or measure just how evil a Republican governor can be? Or attempt some other political point scoring perhaps? Must be some pattern or logic here.
c thomson: People keep on asking this, and I keep on re-plotting. This time, I’ll just show you what I got the last time people asked — see the figures in this post. There is a link in the post to the data; you can generate the figures yourself, if you like (and are able to).
Look, Professor Chinn – not being a WI voter I am only moderately interested in your point scoring against Walker.
I genuinely wonder what you seek to achieve. Plus I can’t be bothered to flip back to old charts about WI. Am I unusual in this indifference to WI issues? I doubt it.
I also wonder whether you have enough data points to establish any great economic significance in what visually appear to be pretty small discrepancies between states.
c thomson: Excuse me for being concerned about the economic prospects for my state. By the way, to put the 2 percentage point differential with respect MN, I wonder whether you’d contemplate your income reduced by 2% with such equanimity as you’ve just characterized Wisconsin’s relative performance. And let me say when reporting data constitutes point-scoring, then it is a sad time. What is it with conservatives and data?
c thomson not being a WI voter I am only moderately interested in your point scoring against Walker.
I’m not a WI voter either, but there’s still a lesson to be learned from the Walker experience. What Walker represents is the GOP Unchained. Wisconsin is a laboratory that tests whether the kinds of economic policies advocated by the purest of the pure conservatives actually works. The standard GOP line is that businesses aren’t hiring because of oppressive regulations, high taxes and a stupid workforce. Well, Walker tells us that he has been busy unleashing businesses from the yoke of regulation; and he has gone out of his way to lighten if not eliminate the tax burden of Wisconsin businesses; and Wisconsin has one of the most educated and literate workforces in the country. And we can see the results. So maybe there’s something wrong with Walker’s economic model, and by extension maybe there’s something wrong with the GOP/Paul Ryan economic model. Maybe the problem is all about weak aggregate demand.
Professor Chinn, aren’t you ducking my point about needing more data points than 10-12 quarters to establish the statistical relevance of economic performance as linked to WI politics vs MI politics and economics?
There seems for example to be a correlation between right to work states and new and renewed industrial activity but I have seen this nicely explained away with various statistics.
Why not just make your political preferences clear? Data is then used appropriately as a weapon. Incidentally I love data. But which data? And for what purpose? And I am no conservative.
I just pulled the relevant data off FRED and noticed that Wisconsin employment growth has lagged the US since at least 2006. Jim Doyle (D) was in office up until 2011.
Now I know Walker said that job growth would be better under his administration. In that sense, Walker has under-delivered. But I don’t see how you can blame the lackluster growth solely on Walker given that the previous five years under a different governor produced similar results.
Yes, Walker over-promised on the job front. Politicians always have lofty goals. Obama was going to unite us, too.
But if you are going to argue Walker’s policies are harming the state vis-a-vis what they would otherwise have been, you have to apply the same criticism to the previous governor as well.
c thomson and Anonymous: Since Anonymous has downloaded the data, and selected 2006, do the following. Rescale the Minnesota, Wisconsin, and US series to 2006M01=1. Then plot. You will see that, yes, WI lagged the US, but so too did MN, until the financial crisis. Then they converged. The US, WI, and MN tracked pretty well until…the end of 2010. Then, WI diverges (i.e., lags). Try doing it — you’ll find it illuminating.
Try again.
Three years? Can you prove that the lag isn’t a coincidence? I doubt it.
This is politics. Pure fun. Why not admit it?
c thomson: Since you have the data, you can test the proposition you forward. I have done it for you if you don’t have a statistical package, and appended the results at the end of the post.
Try again.
Of course, isn’t it possible that the unemployment rate in Wisconsin might have been higher without Walker’s policies?
I defer to Acemoglu and Johnson’s designation of all politicians as rent seekers, with R’s and D’s sharing this trait and separated by minor differences in actual policy implementation (though they can bloviate about differences in what they do).
And, all in all, most politicians in office over-propose and under-perform, as shown by the above graph.
The 3 years of data is enough to provide a minor robustness check (remember that you can re-scale the data, down to, say, days, to achieve more “data points” if that’s the goal that you’re trying to score) about the efficacy of Wisconsin’s job creation plans. It appears to provide an upper bound on the impact of a R governor that underwhelms when his plans are implemented.
I’m sure the same thing could be done based on a plan that Democrats initiated somewhere.
As Professor Chinn has noted, a discrepancy of 2% points, even if it was not statistically significant, can be of great magnitude. In a state of 100,000 individuals, that is 2,000 less people with a job. With close to 6,000,000 individuals in Wisconsin, that is around 120,000 individuals without a job.
And yes, more data are always useful. But you sometimes have to work with what you have. In wage regressions, people would love to have a perfect proxy for ability, or even ability itself. That is not feasible. There are certain omitted factors that may play a role beyond the dummy variable for a Republican governor that are being omitted, but in a quick and dirty approximation, you achieve the results.
“Wisconsin is a laboratory that tests whether the kinds of economic policies advocated by the purest of the pure conservatives actually works. ”
2slugbaits is a troll of legendary proportions
Professor Chinn,
Is it possible for you to show a few screen shots of your model or link a data file? I am using Eviews and seem to have found a coefficient of -.0103 and what I believe is a HAC standard error of .0037. I am sure you are correct; I’m just trying to gain some knowledge.
Thanks.
What other than public employee pension and bargaining right reforms has the Walker Administration implemented?
Well, if I were Governor it would be somewhat concerning, and Prof C is free to score points.
But now that we this data, I’m curious where WI is in terms of defecit growth or reduction over this same period. Because if that has gone up too, the Walker needs to go.
AS: I put up the regression output here. DEV pertains to total nonfarm payroll employment. DEV1 pertains to private nonfarm payroll employment.
Shouldn’t you have used a one-tailed test?
Professor Chinn,
Thanks.
I notice that the Eviews output that you posted has data ending 2013M01. I had used data ending 2013M04. After adjusting my data, I got the same answers as you show on the output link. Using log of PRIVATE nonfarm data, DUM of -.007736 with SE of 0.002988 and “t” value of -2.589.
Thanks again!
AS: Thanks, hadn’t realized I’d accidentally truncated the data to 2013M01. Well, good to know the result gets even stronger with more data.
Originally, I did not see the notation of private non-farm, so I also did not use the correct data on my first attempt to compare to you.
Professor Chinn,
Comparing Minnesota to Wisconsin, I notice that MN seems to have caught fire starting about July 2012 while WI seems to bumping along. What do you think the reasons are? What has MN done right and WI done wrong?
Petty Quibbler: Yes, for alternative WI growth is lower. If my alternative is WI growth is different from US, then two-tailed is right. In this case, one rejects at 1% regardless of test.
AS: Not sure I have an answer. Some longer-term possibilities mentioned by Louis Johnston.
If you look into MN’s numbers and projections, they show growth across service sectors and a rebound in manufacturing and construction. A lot of the higher income growth is in technical fields. There is healthcare job growth and there of course has been growth in lower paid jobs as well. No single thing stands out.
BTW, an MN group has analyzed job growth in the state after tax increases, decreases and then during periods of tax stability. Job growth was higher after tax increases – higher than periods of stability – and actually dropped versus stable periods after a tax decrease. I can’t say why and have no idea if tax decreases may have been associated enough with poorer overall economic conditions or what.